It’s been a while because things have been fairly busy for the past few months, but although there have been no posts, the photo archive has continued to accumulate. This includes the usual commuter photos following the changing landscapes and seasons between Colchester and London, but there have also been longer trips to western Scotland, Edinburgh and Chichester. I’ve decided to work in reverse order and post one of the most recent trips first – a visit to Langholm Moor for the IUCN UK Peatland Programme and the Crighton Carbon Centre in order to look at ways of restoring the carbon-capturing capacity of the blanket bogs on this estate. The details of the visit itself – fascinating though it was – are not for this blog, although I do want to heap praise on the estate, the Crighton Carbon Centre and the IUCN UK Peatland Programme for the enthusiasm with which the peatland restoration programme is being approached. This blog, on the other hand, captures the landscapes and cloudscapes – and weather – which were encountered during the train journey between Colchester and Lockerbie, plus a couple of landscapes from around Langholm Moor itself.
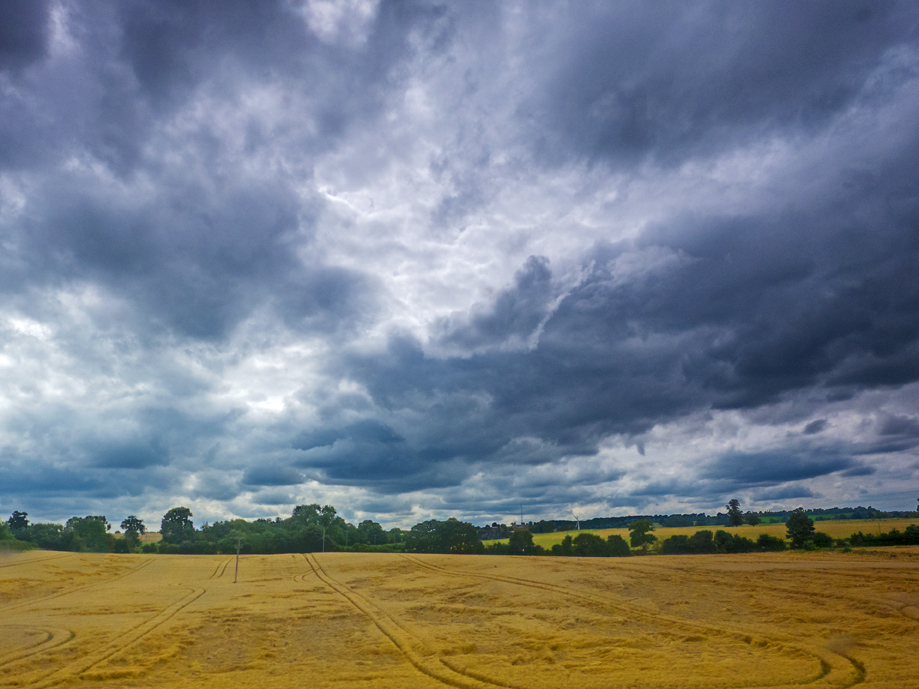
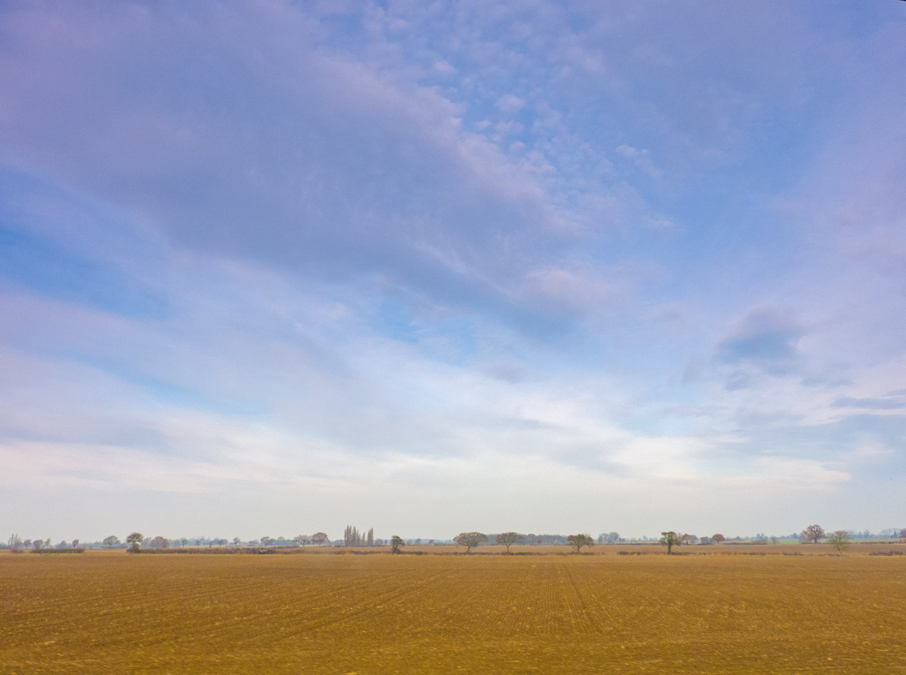
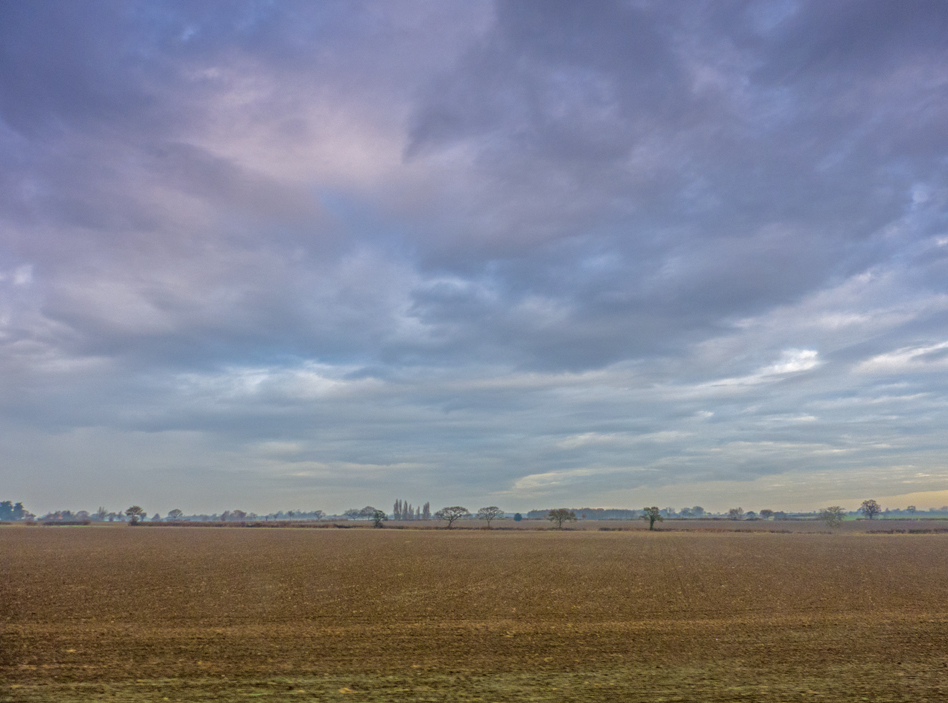
The route involved going via London, but there were no opportunities for photography during the journey between Colchester and London, so the landscapes begin north of London, on the Virgin West Coast Line. The weather had been typical of a British summer – i.e. wet and windy – but fortunately the featureless nimbostratus weather had drifted off east towards the continent, leaving a more broken, and therefore more dramatic, sky as we sped north-west past Rugby. I think the brown stalks so widespread by this time of year may be oil-seed rape after harvesting. Meanwhile the wheat had yet to be harvested:
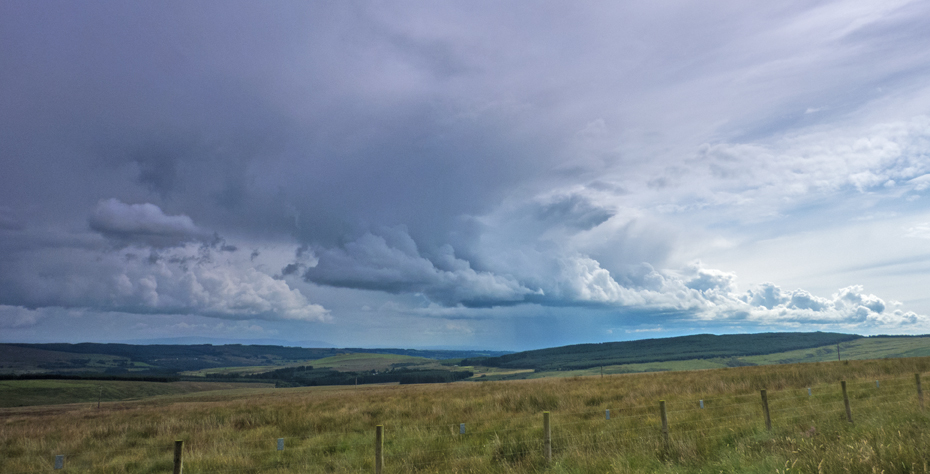
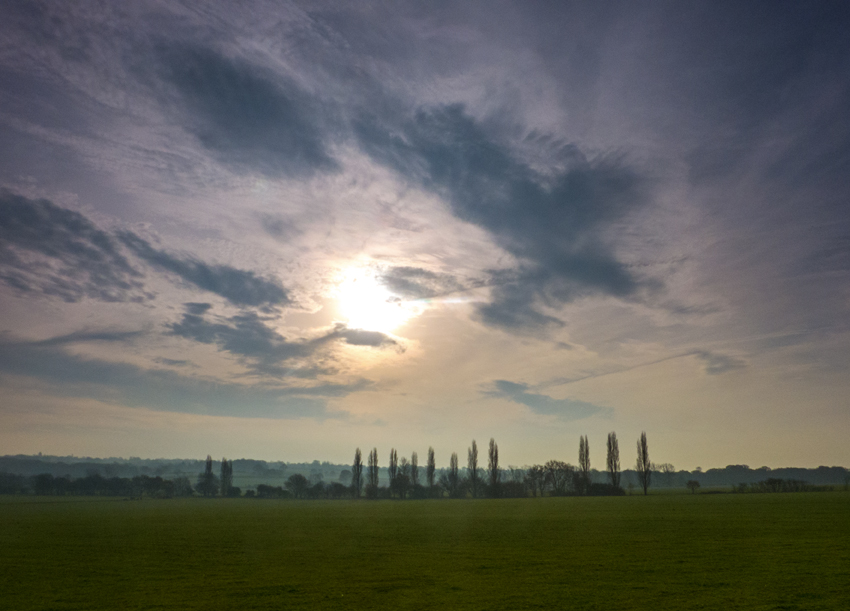
The powerful vortices associated with wind and rain had flattened extensive parts of the various wheatfield crops, and the threatening sky hinted at more to come.
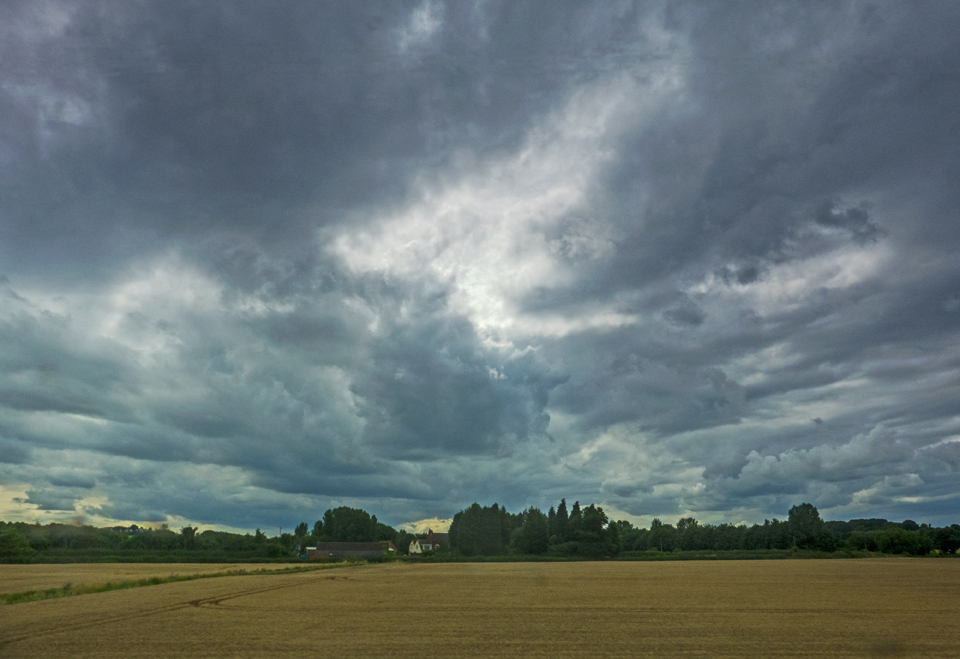
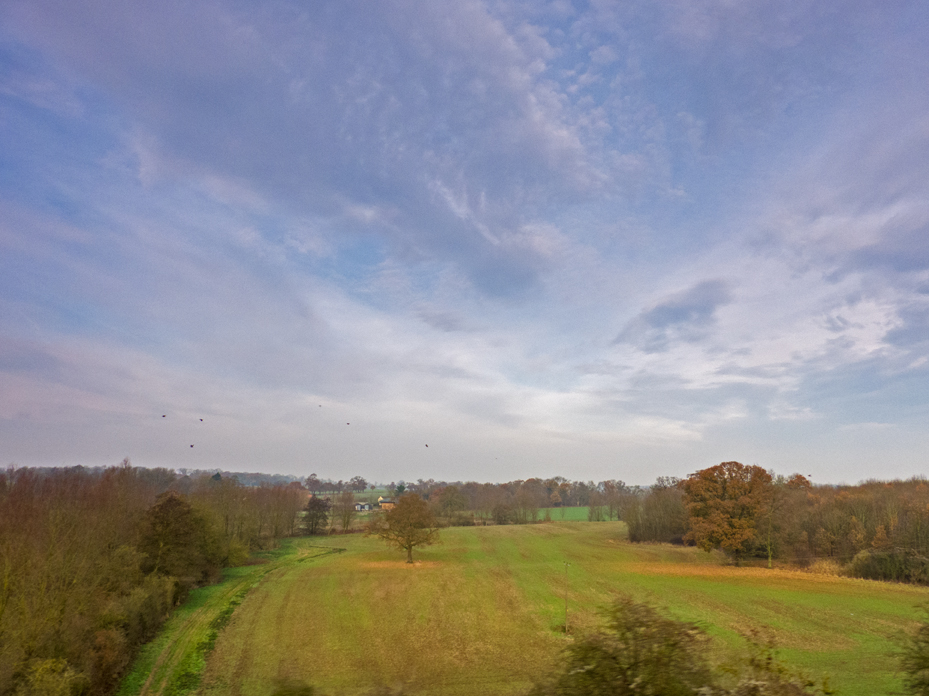
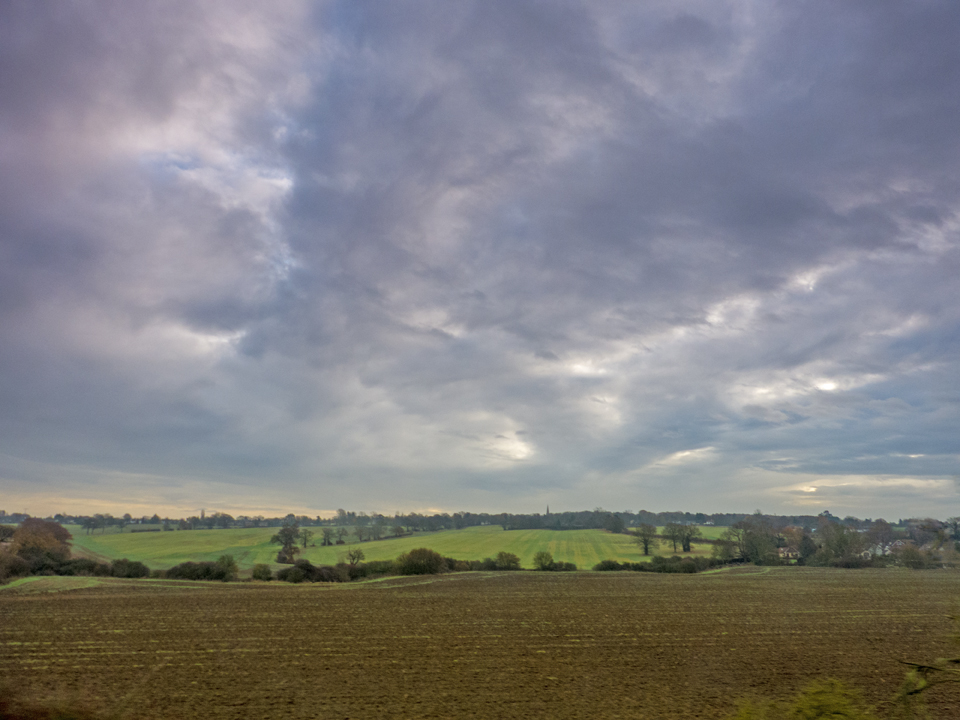
Further north it seemed that the wheat had not suffered so badly, although the skies were equally dramatic.
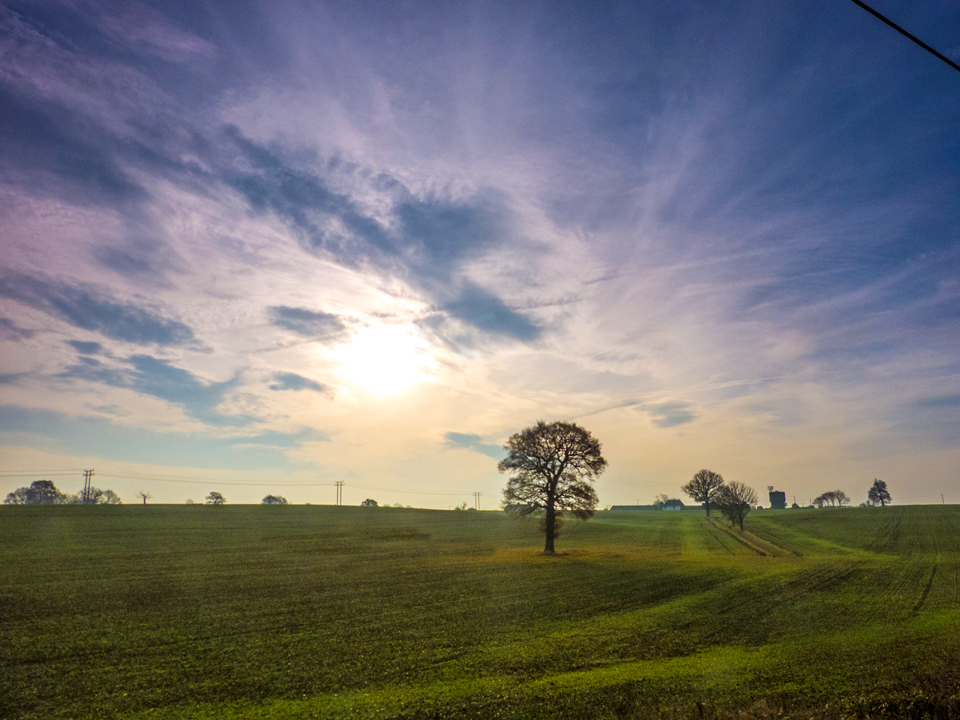
Indeed it looked as though we were heading towards the heart of the storm at this point.
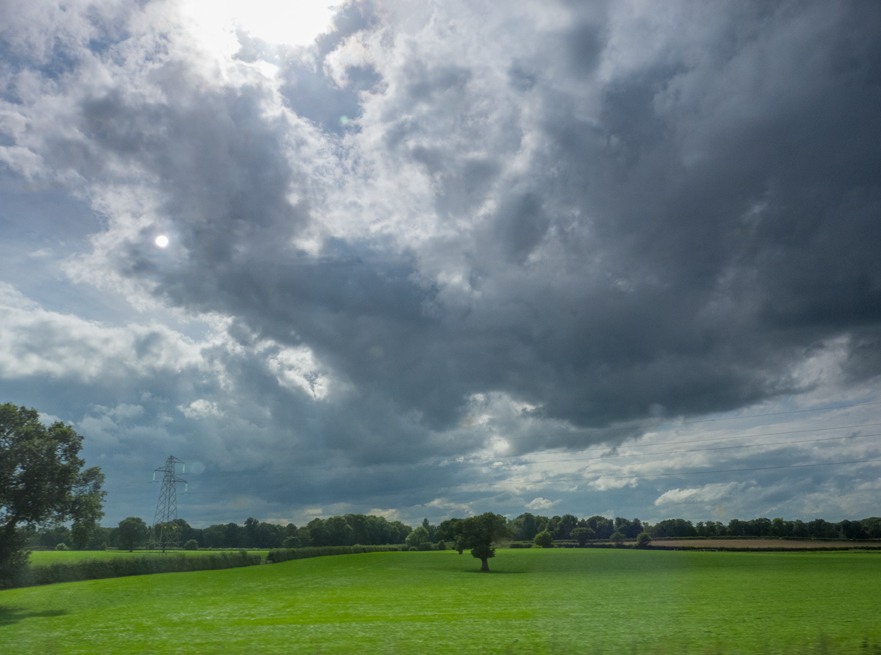
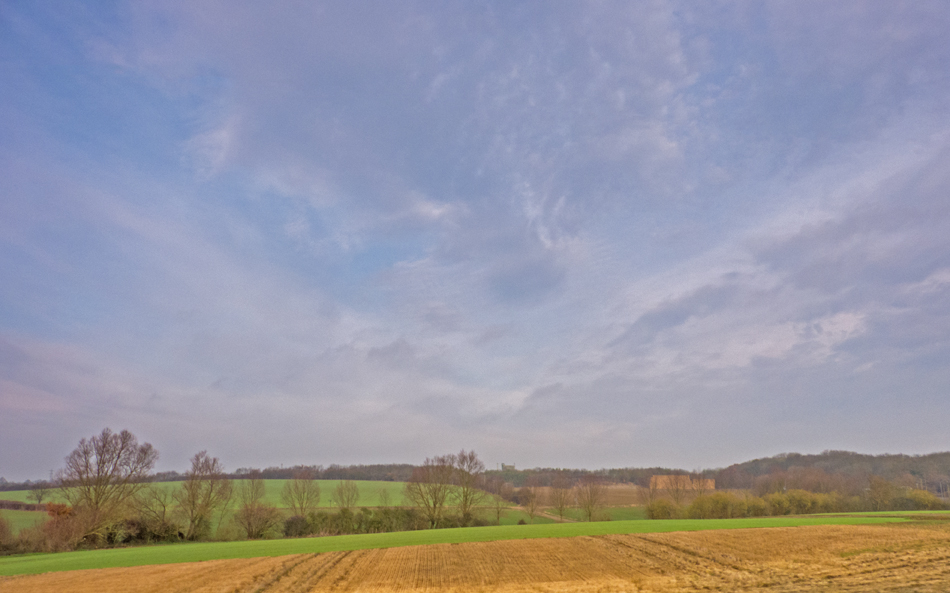
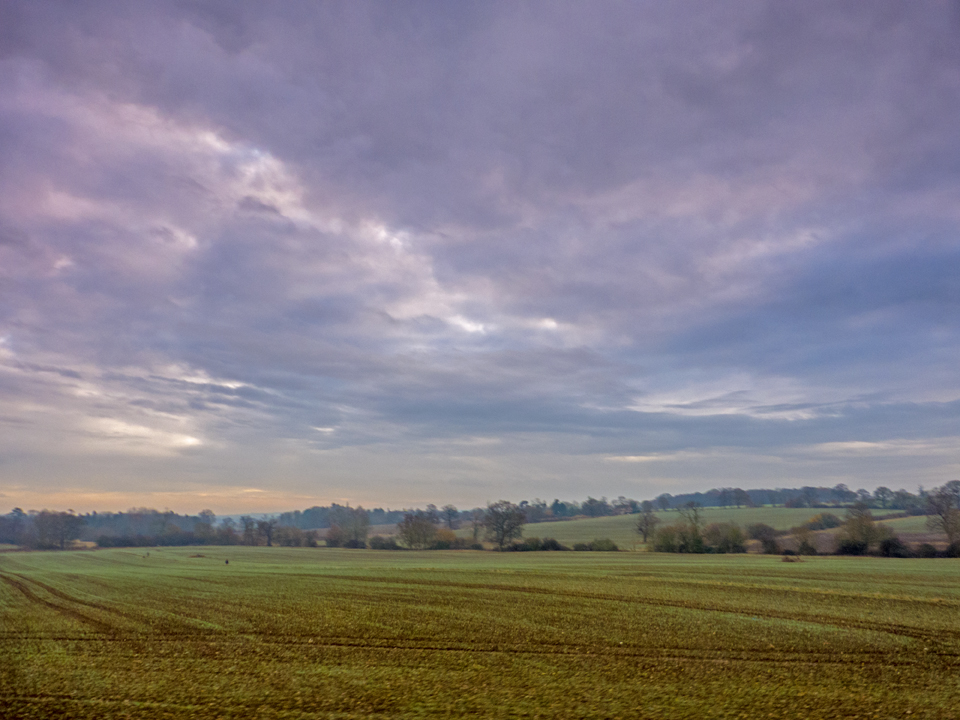
Then abruptly the sun broke through and there was, albeit briefly, blue sky above.
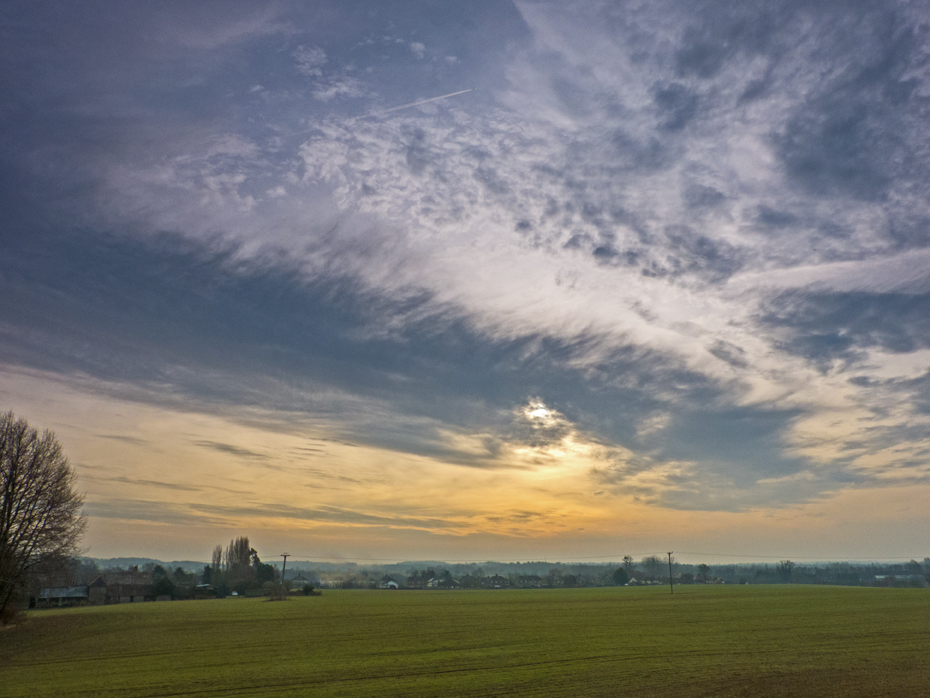
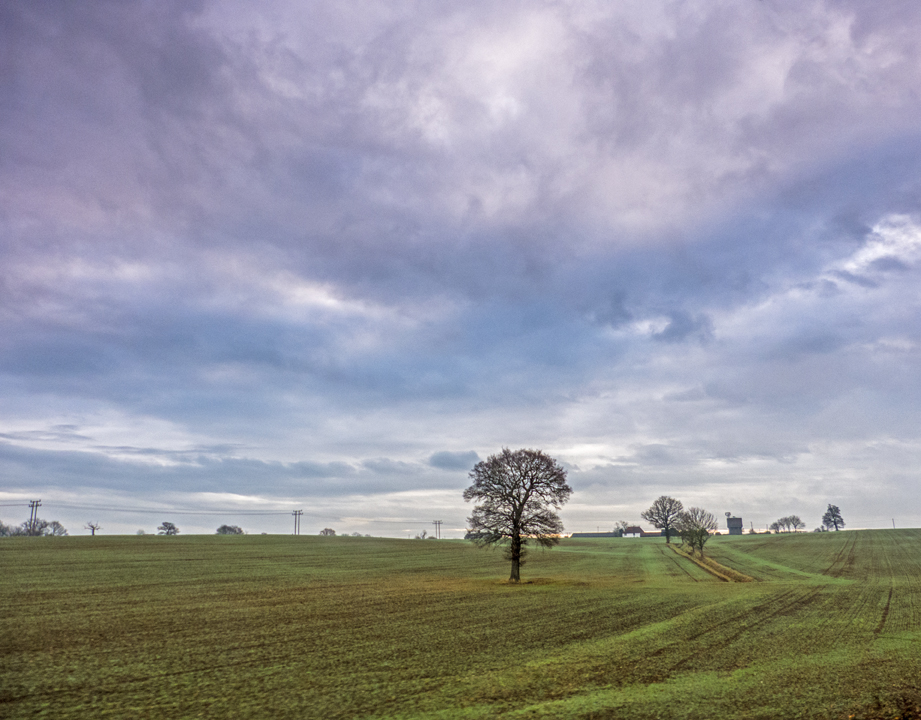
Just as quickly it vanished again, as though we’d gone through the calm eye of the storm, and the dramatic skies returned.
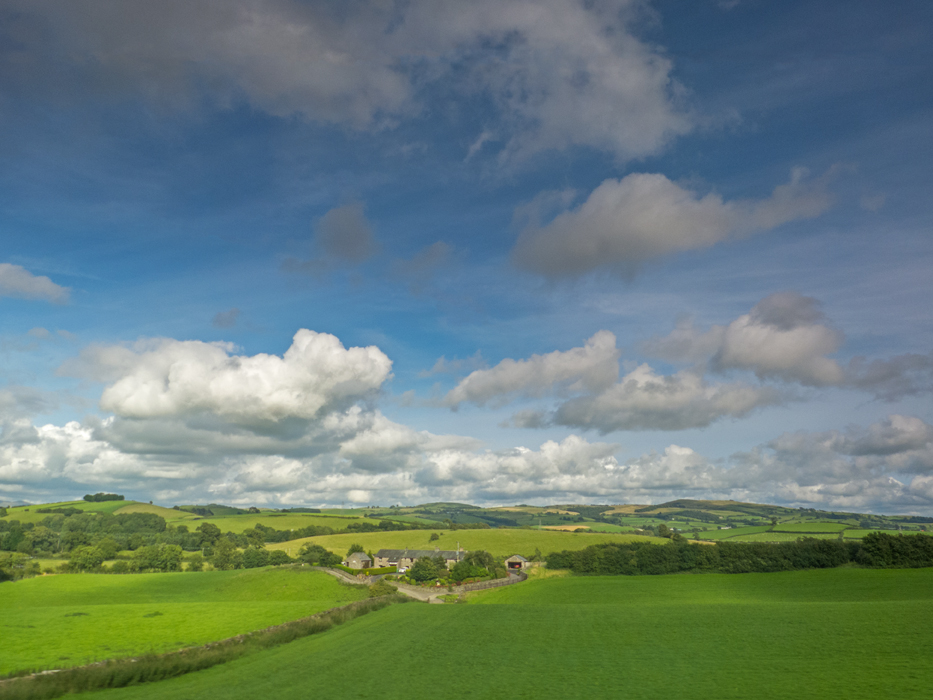
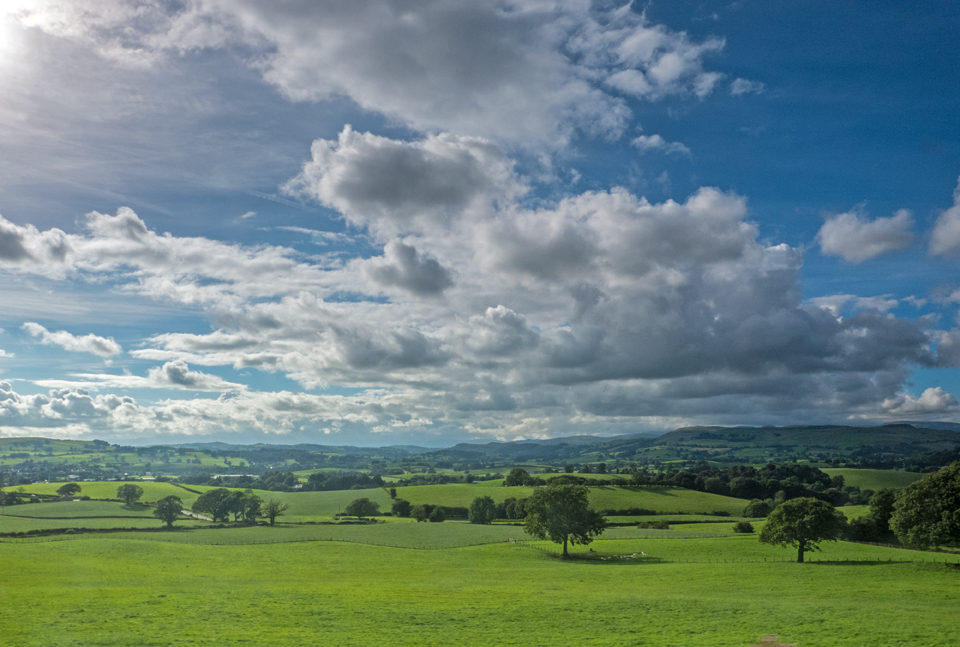
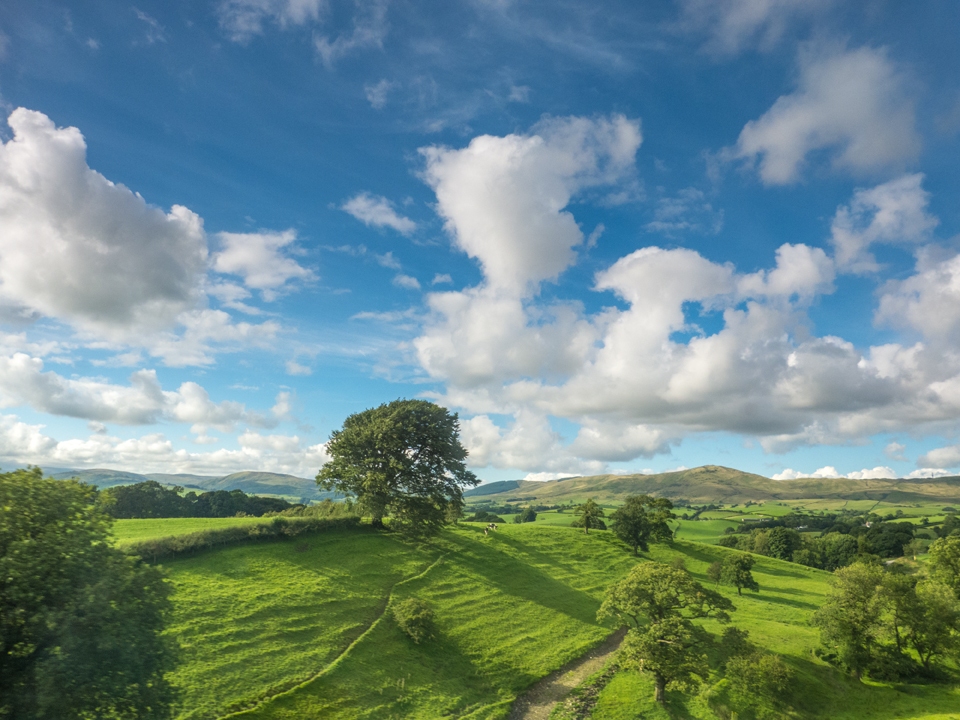
Then as we approached Oxenholme and Kendal, gateway to the Lake District (where my career started back in the 1970s), the skies abruptly cleared and we were bathed in glorious sunshine. Picture-book stuff:
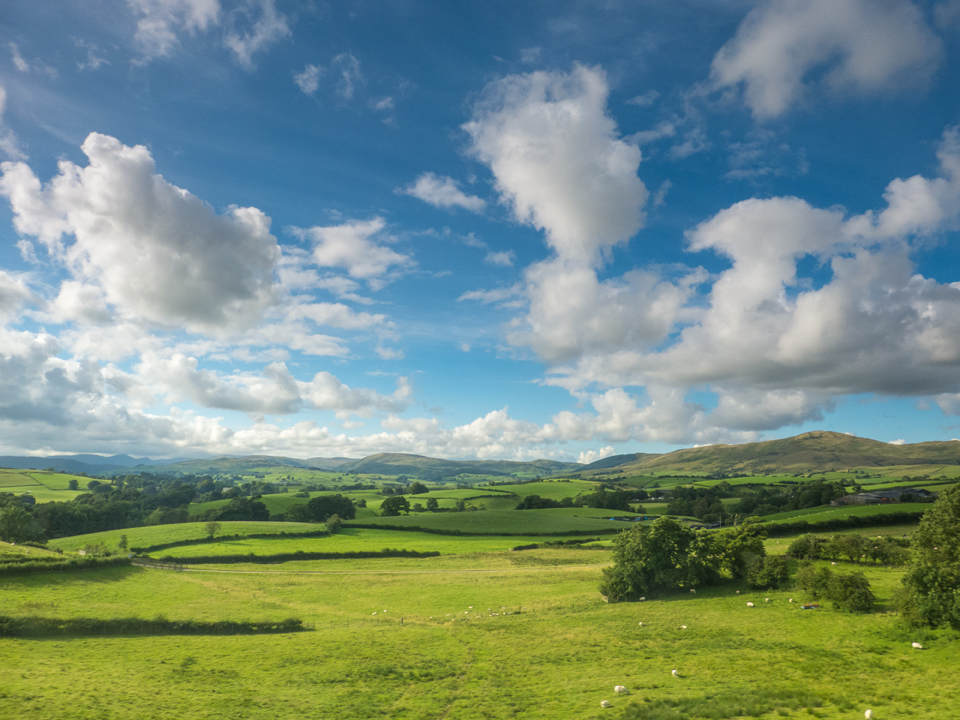
The line wound round the hills heading up towards Shap and Penrith, mostly giving opportunities for views to the north and north-west. Due west generally meant photographing directly into the sun, limiting the opportunities for photographs through the train window because any dirt or scratches on the train window simply turn into glaring star-bursts which flood the scene and make for interesting artistic images but lousy landscape photography. Every now and then, however, the sun would disappear behind a small cloud and a view due west was possible.
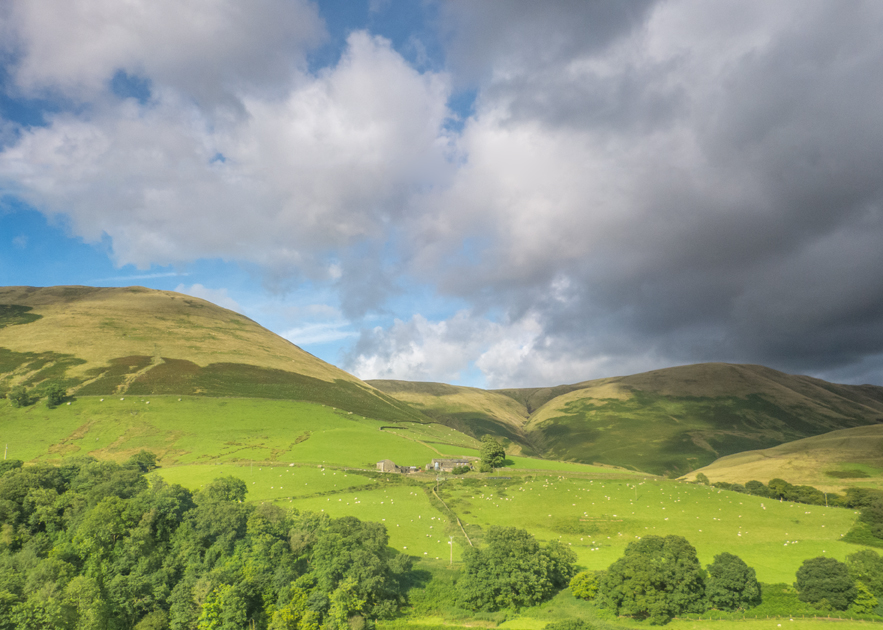
The winding route past the Howgills is always somewhat breath-taking whether from the train or driving along the M6.
North of Penrith the view east across the intervening fields of the Eden Valley towards Cross Fell, highest point on the Pennines, was wonderfully clear.
The air felt clean-washed – as indeed it was after all the rain of the past week.
A bit of detective work using Google Maps, the excellent Magic Map and the so-useful what3words suggests that the grand building on the right may be Barrock Park, just near the M6 Southwaite Services.
Crossing the River Esk just to the north-west of Carlisle, we approached the Scottish border and the clouds began to gather again.
Within 15 minutes of heading west around Gretna Green, the rain and gloom descended…
The prospect of walking the half-mile or so to my hotel from the station in Lockerbie was starting to look less and less attractive.
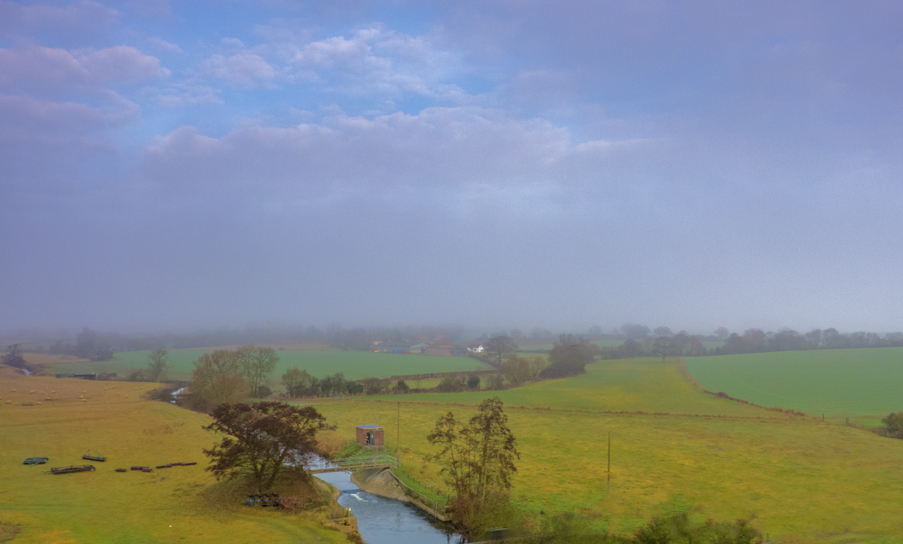
But then a little ray of sunshine and a little ray of hope. Off to the west as we approached Lockerbie the sky looked brighter.
…and the rain stopped just as I walked out of the station 🙂
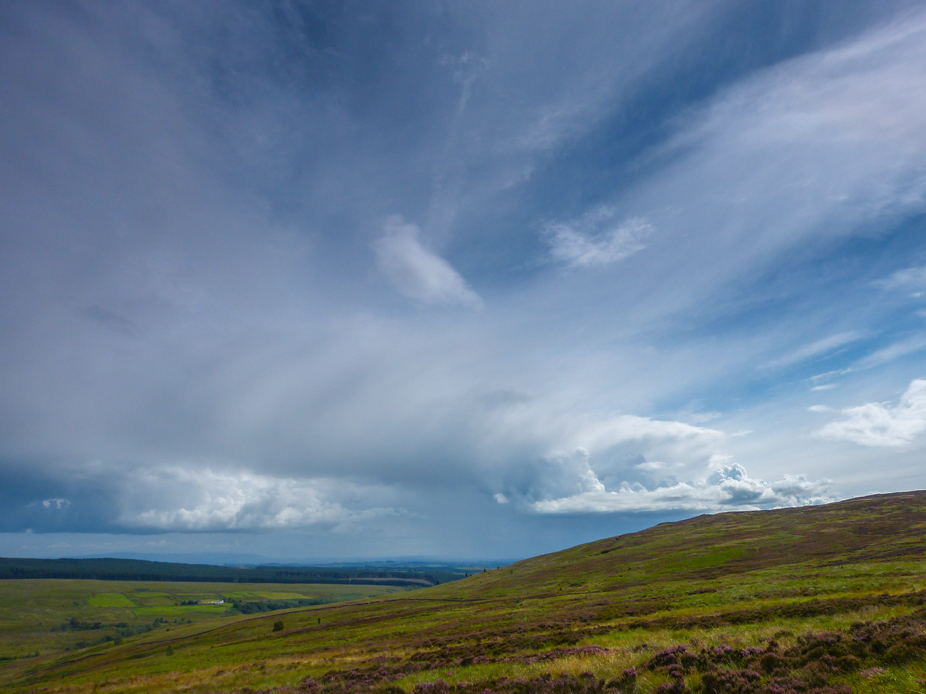
Next day we enjoyed glorious views from the top of Langholm Moor. We could see the coast to the west, almost to Edinburgh to the north, Kielder Forest to the east over the border in England, and way south down to the Lake District. The threatened rain very kindly kept away all day, though several spectacular cloud formations (doubtless with drenching rain beneath) circled us during the course of the day.
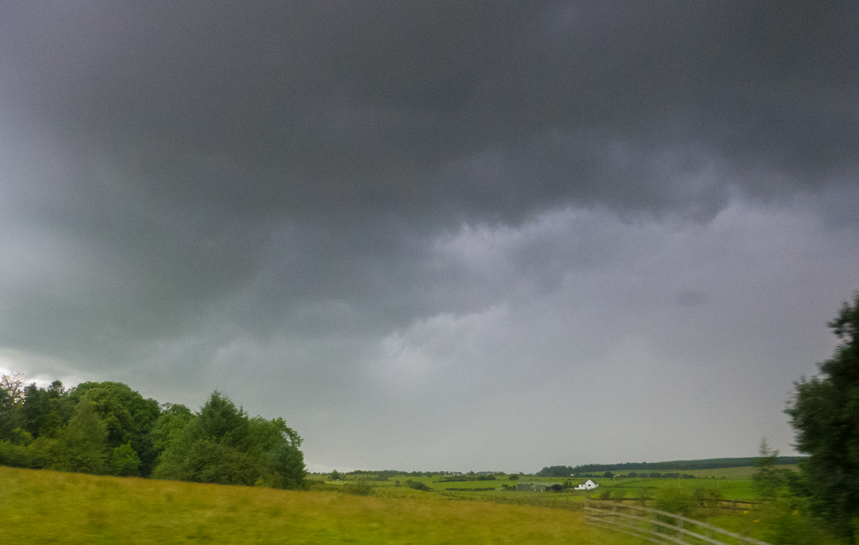
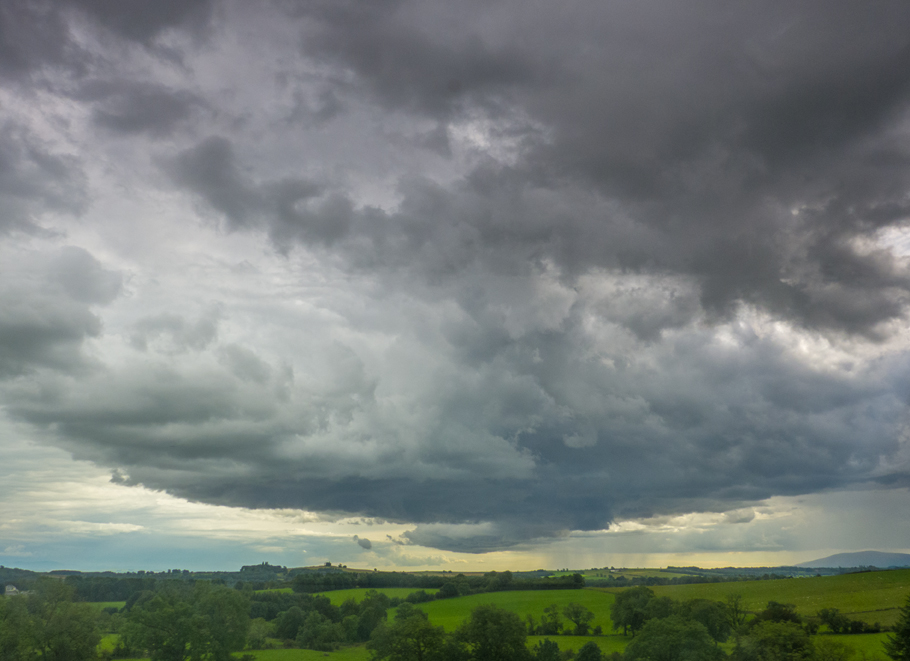
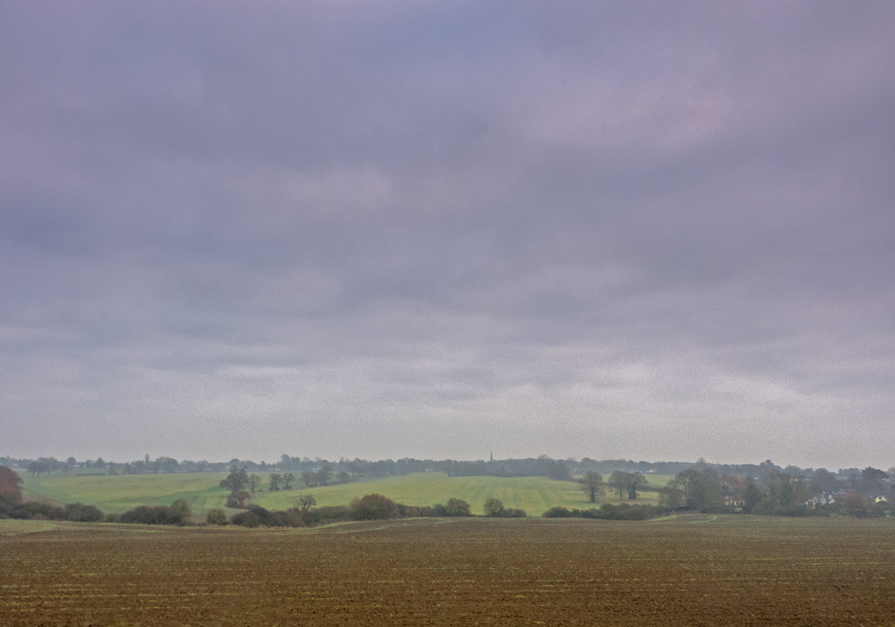
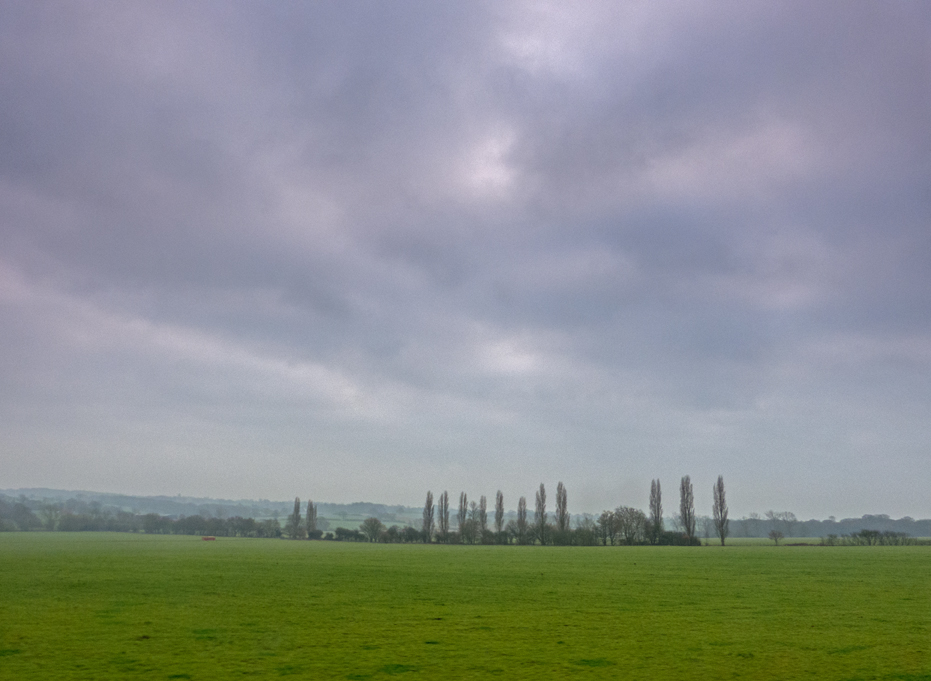
Then finally, having been dropped off back at Lockerbie Station, the rain returned to provide a fitting coda and sense of symmetry to the whole trip. First it was brief showers as we headed back to Gretna Green and the English border.
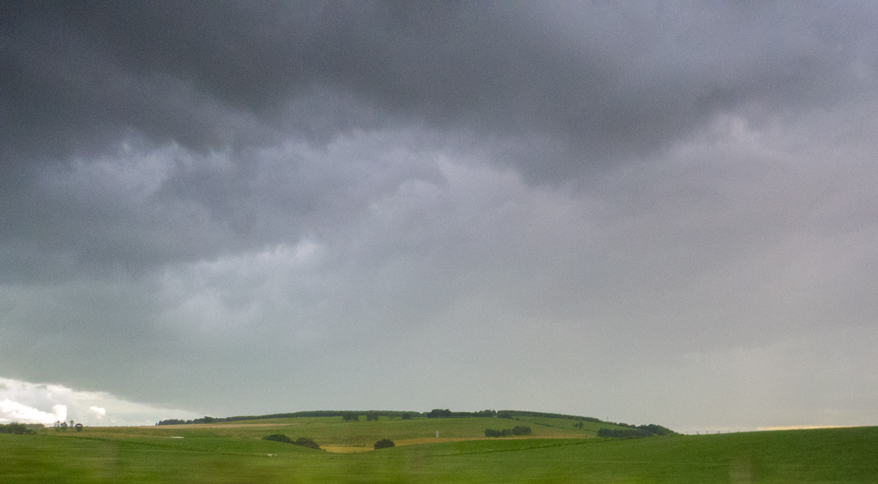
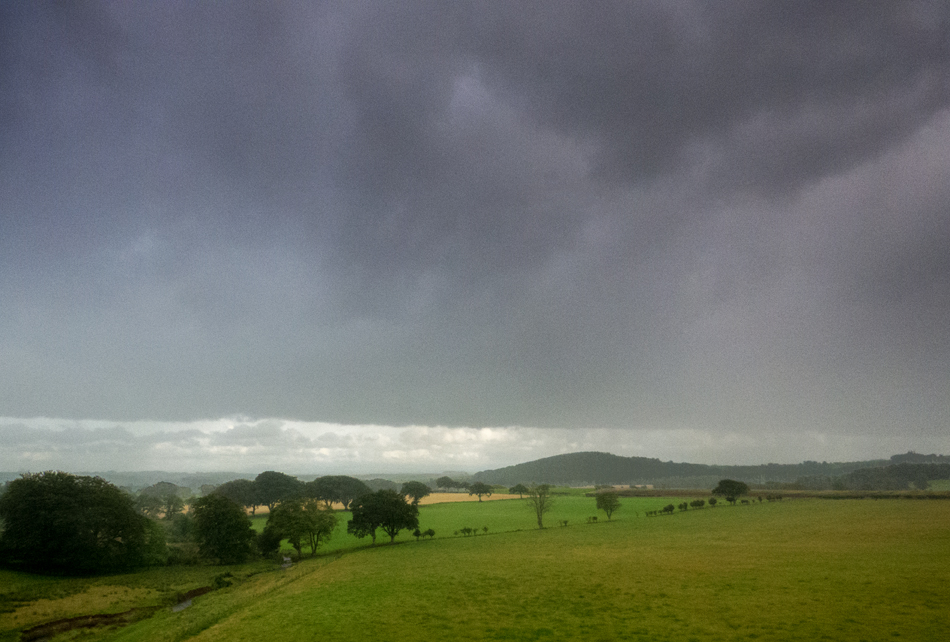
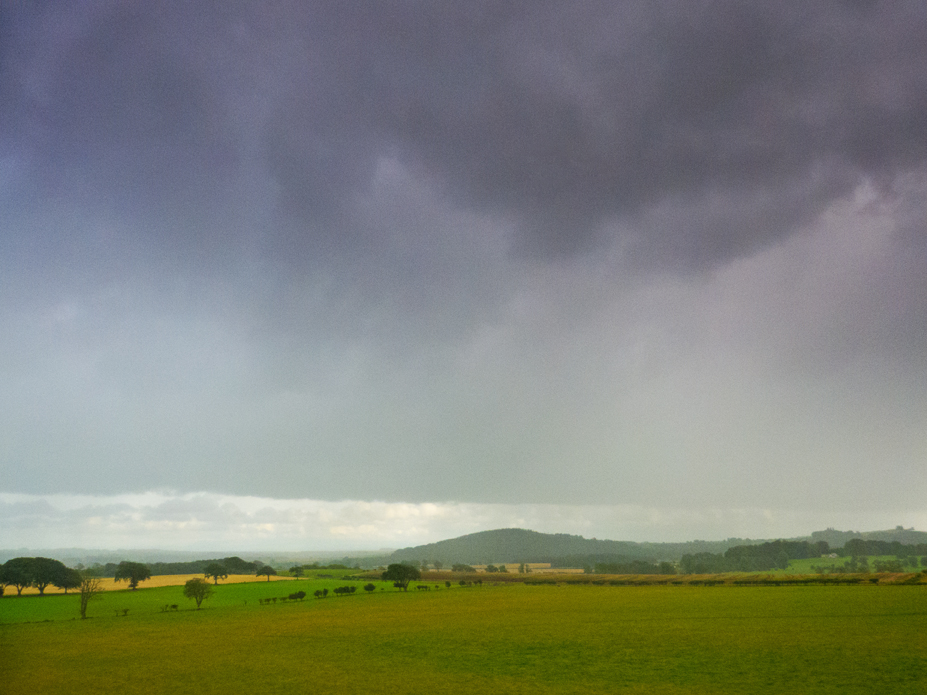
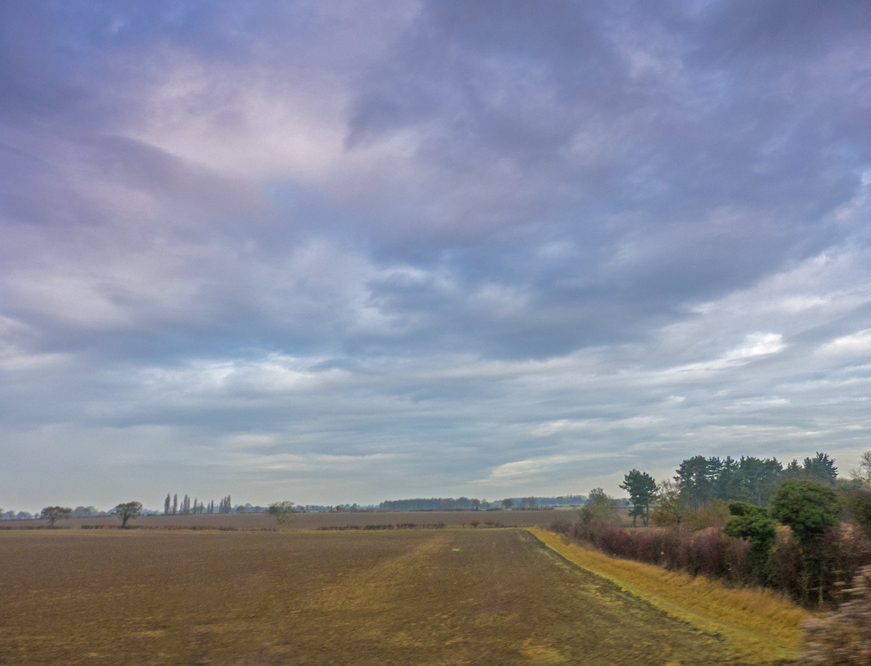
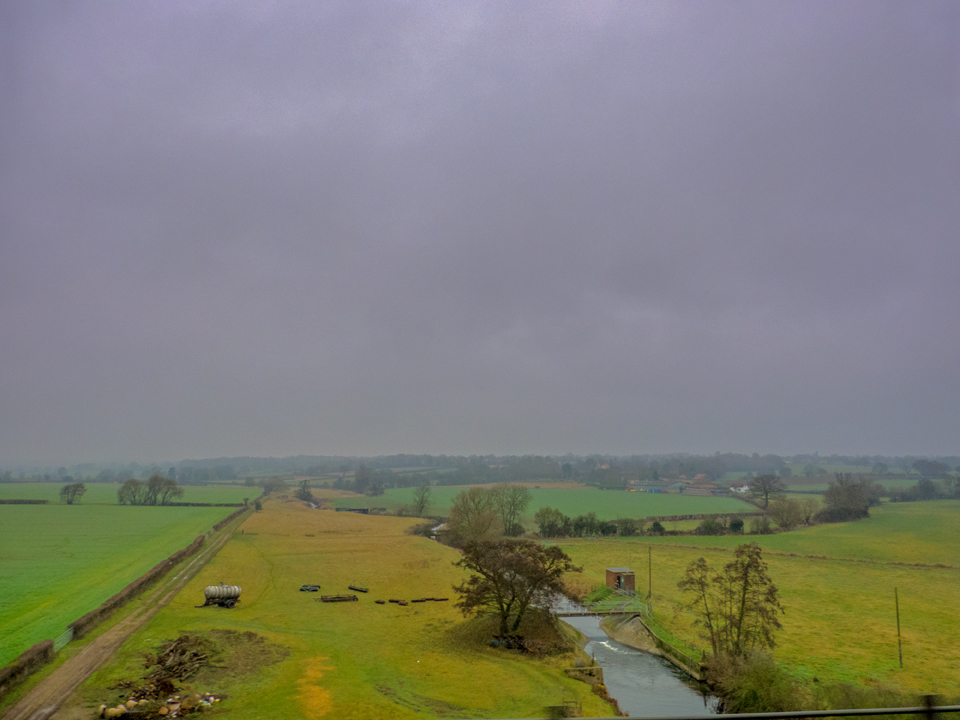
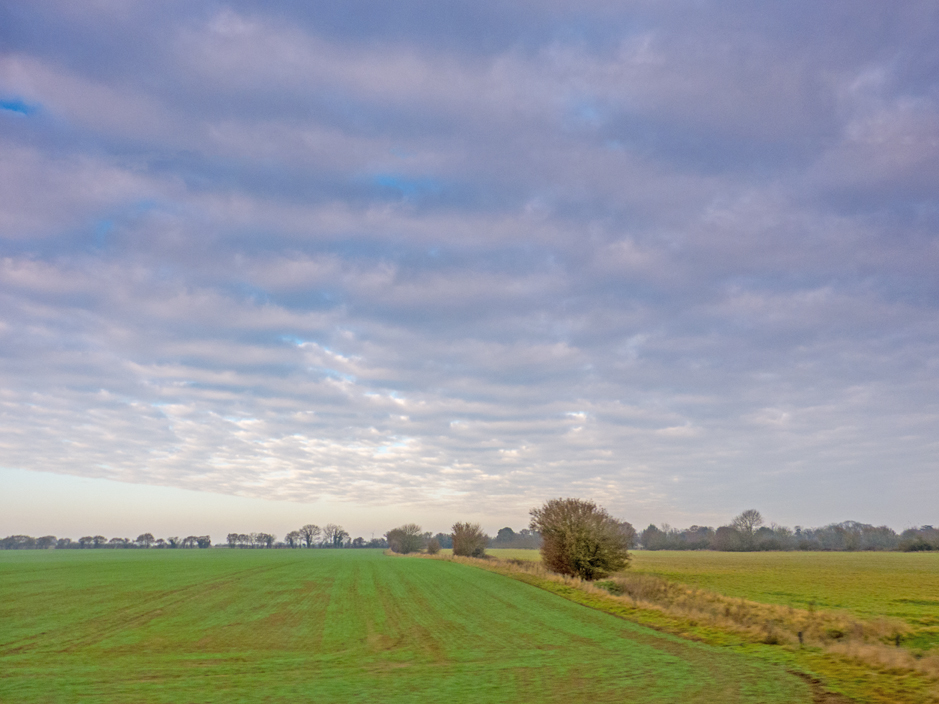
The clouds thickened steadily, so it was a good thing that the farms along the route had been busy…
Then finally, crossing the Esk again, the clouds congealed (it’s the only word to describe it) into a thick layer of stratocumulus and the lights went out, leaving the remainder of the journey rather less interesting than the journey north had been.
The South Downs, Chichester, peregrines, Spitfires and painting accidents next time…!
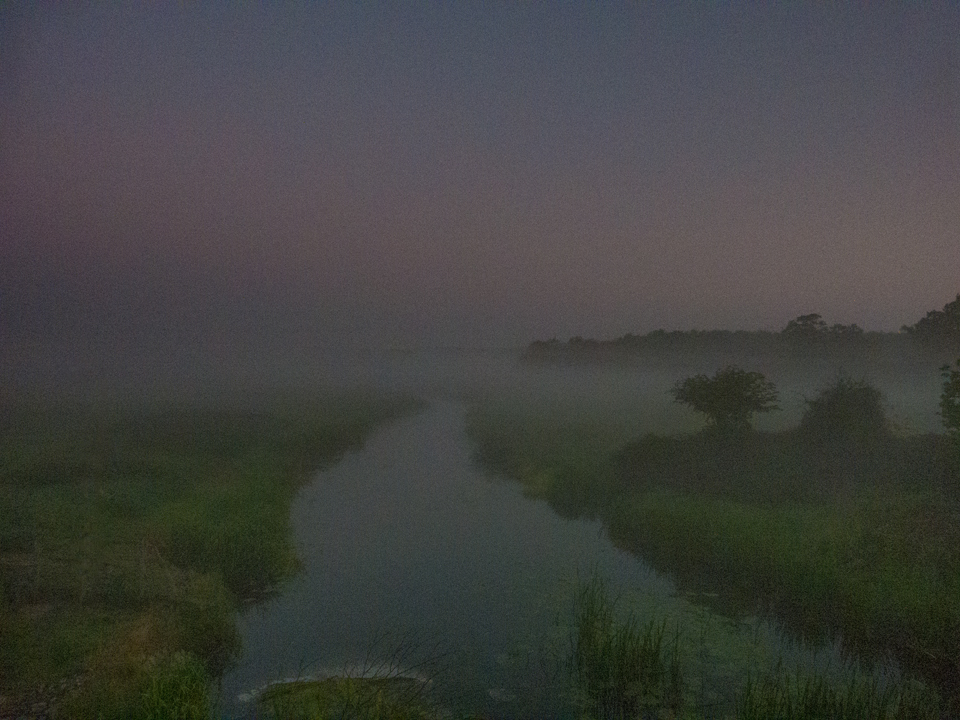
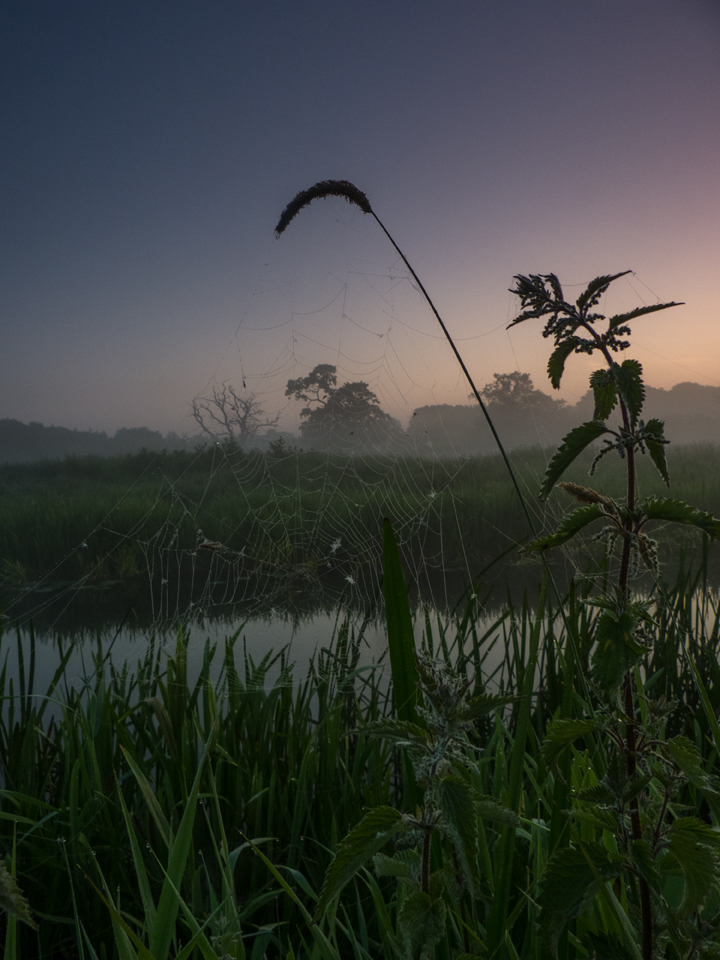
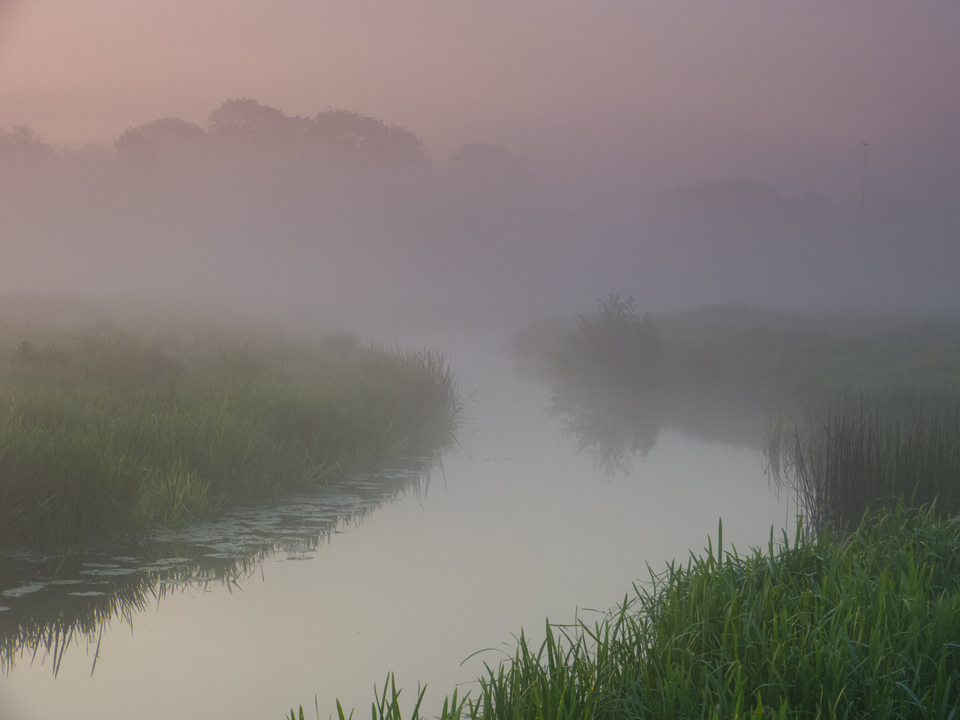
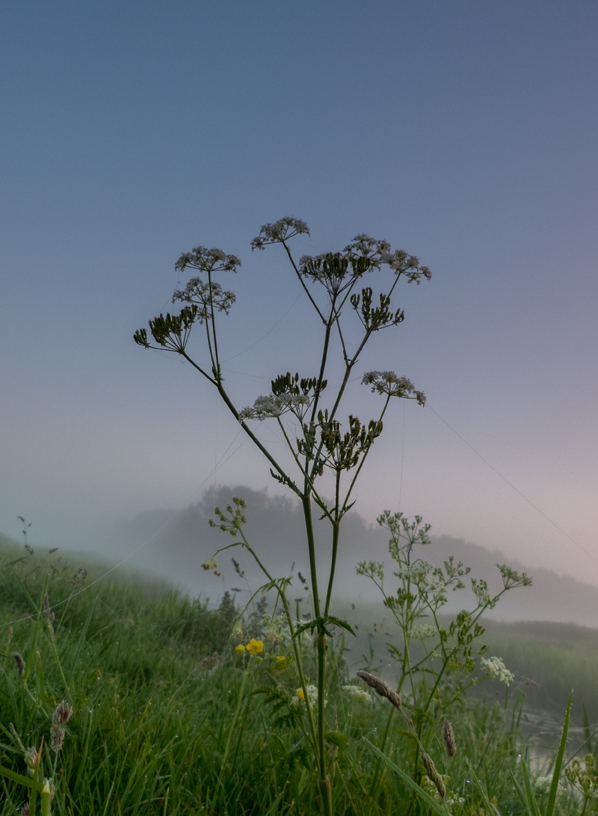
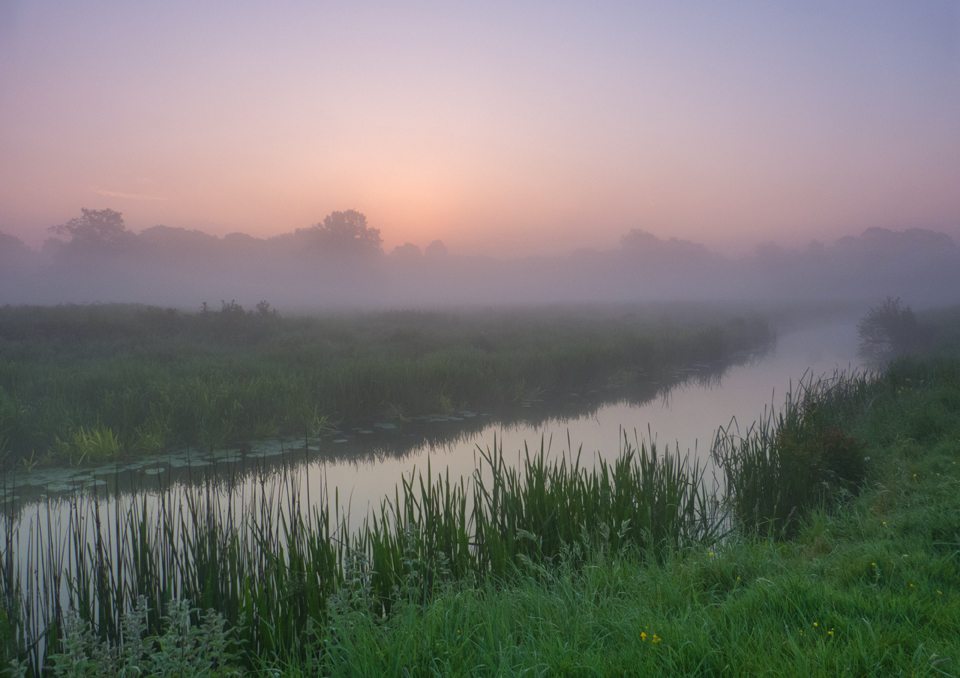
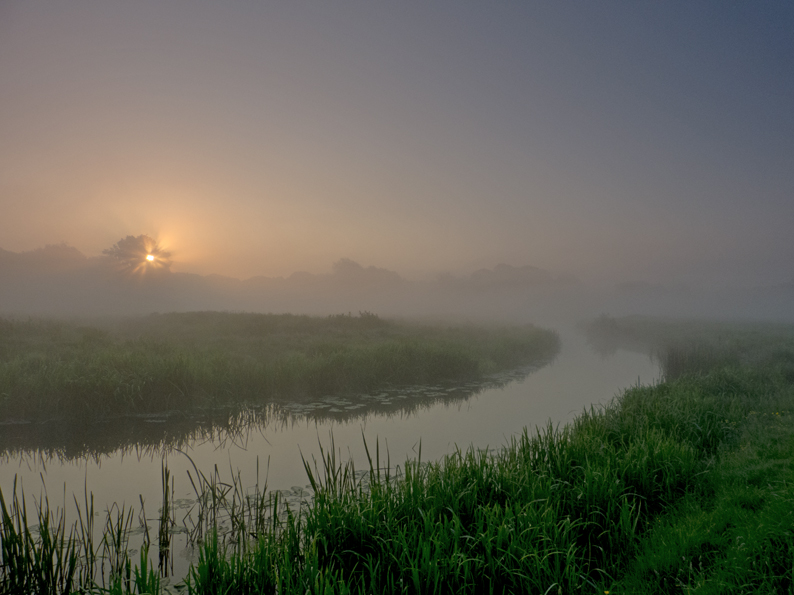
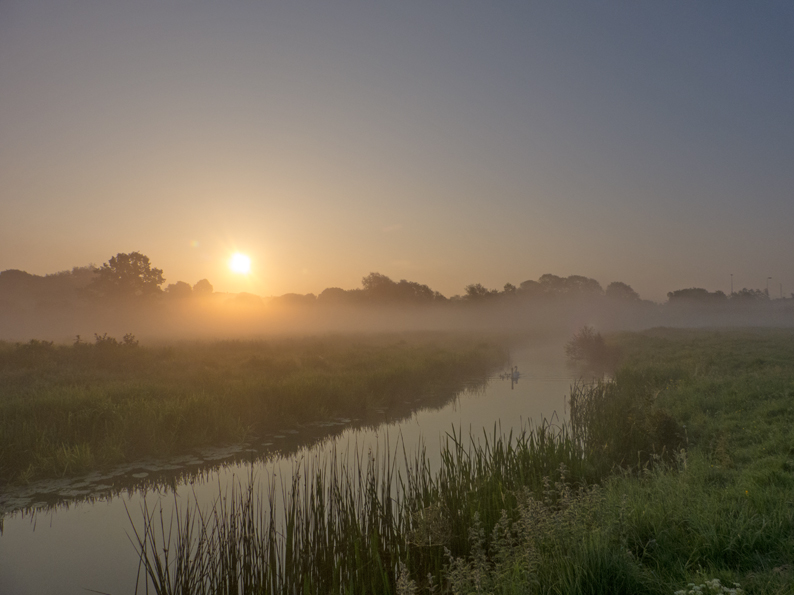
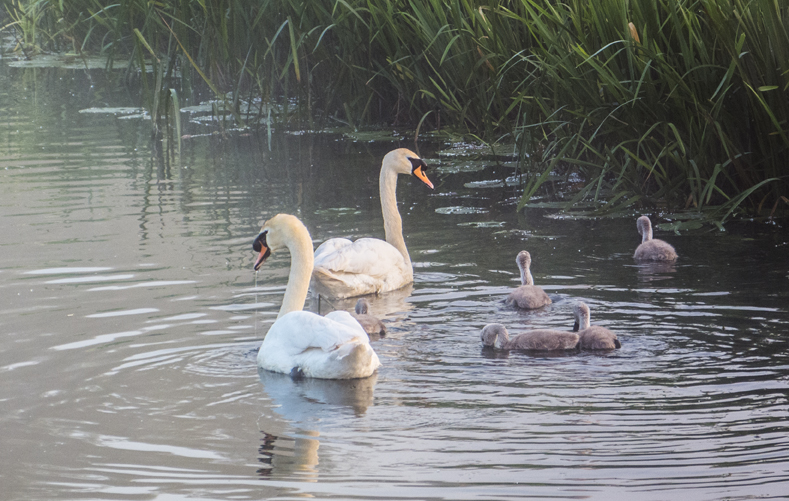
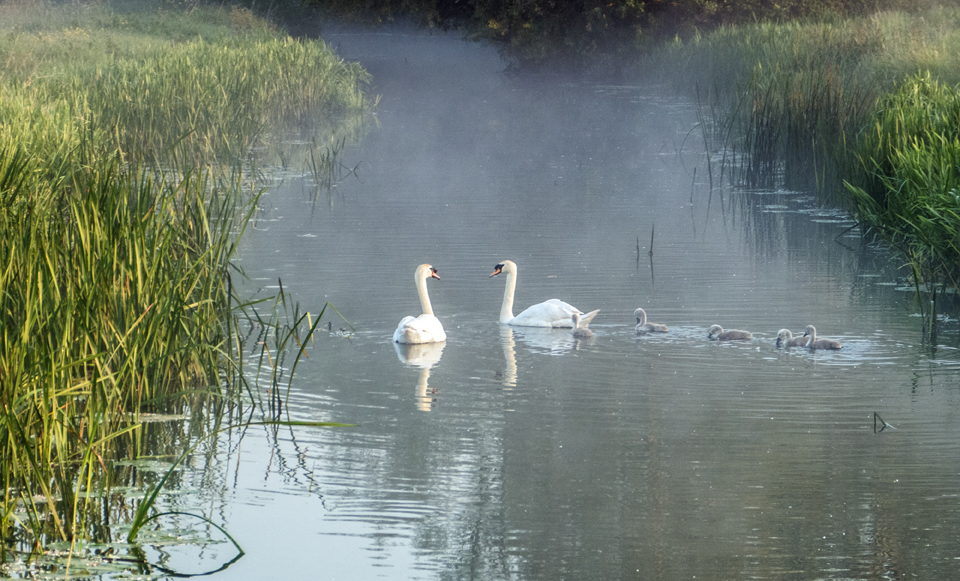
It’s been almost 6 months since my last blog, and after events in Manchester this week, words just aren’t there. Driving through the towns wiped from the map by the Japan 2011 tsunami left me similarly wordless. Only pictures then, of a dawn over Colne Meadows:
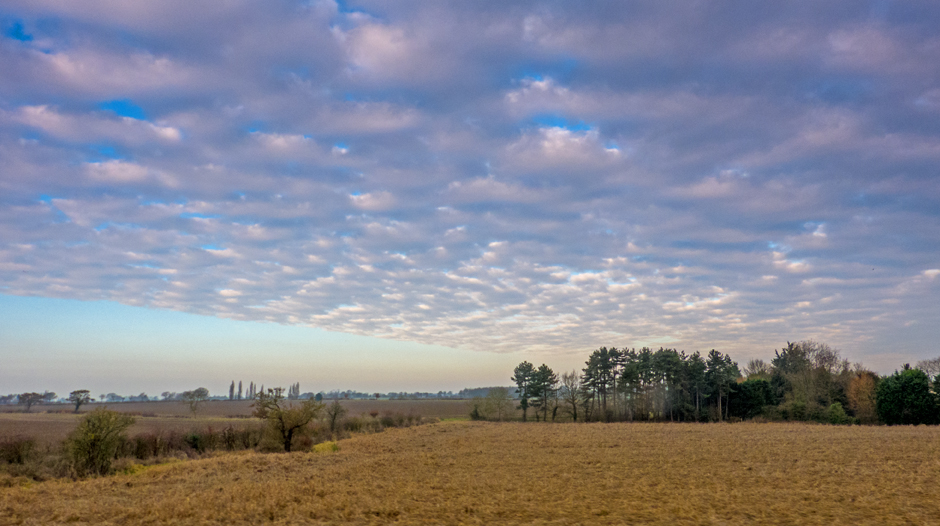
OK, it’s Boxing Day and there’s been no ‘commuter’ photos for December. This is mainly because the weather in December has been pretty damp and miserable without any really breathtaking skies – but there have been a few moments of fun (on days without such fun I have been reduced to tackling the ‘Codeword’ crossword in the Metro – something which my 10-year-old daughter and I subsequently find an entertaining challenge involving much imagination and invention of English vocabulary worthy of Shakespeare).
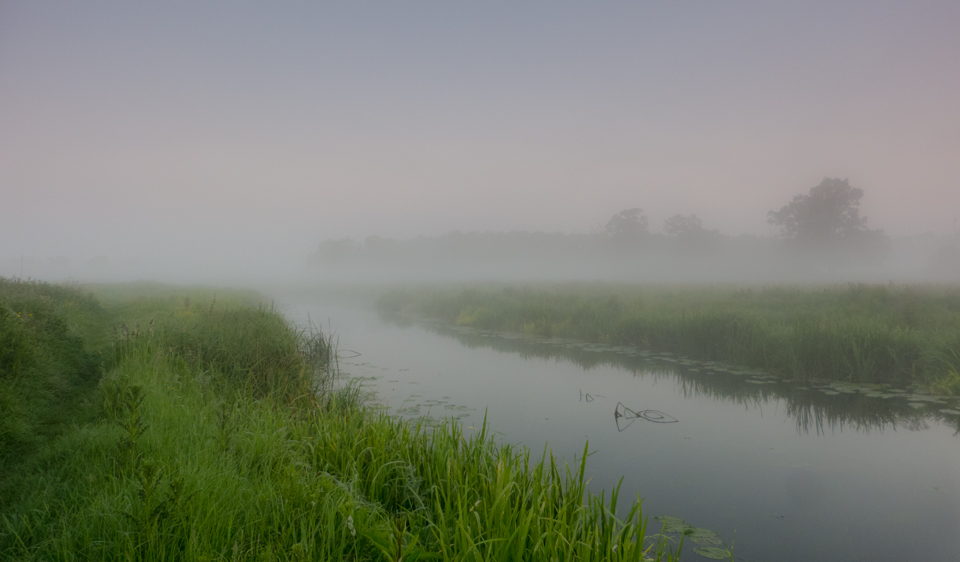
Early December (specifically 6th December) was characterised by fog, which amazingly didn’t seem to faze Abellio Greater Anglia at all, the chaos arising instead from “adverse rail conditions” – which we all interpreted as ‘leaves on the line’. The fog did make the journey somewhat magical:
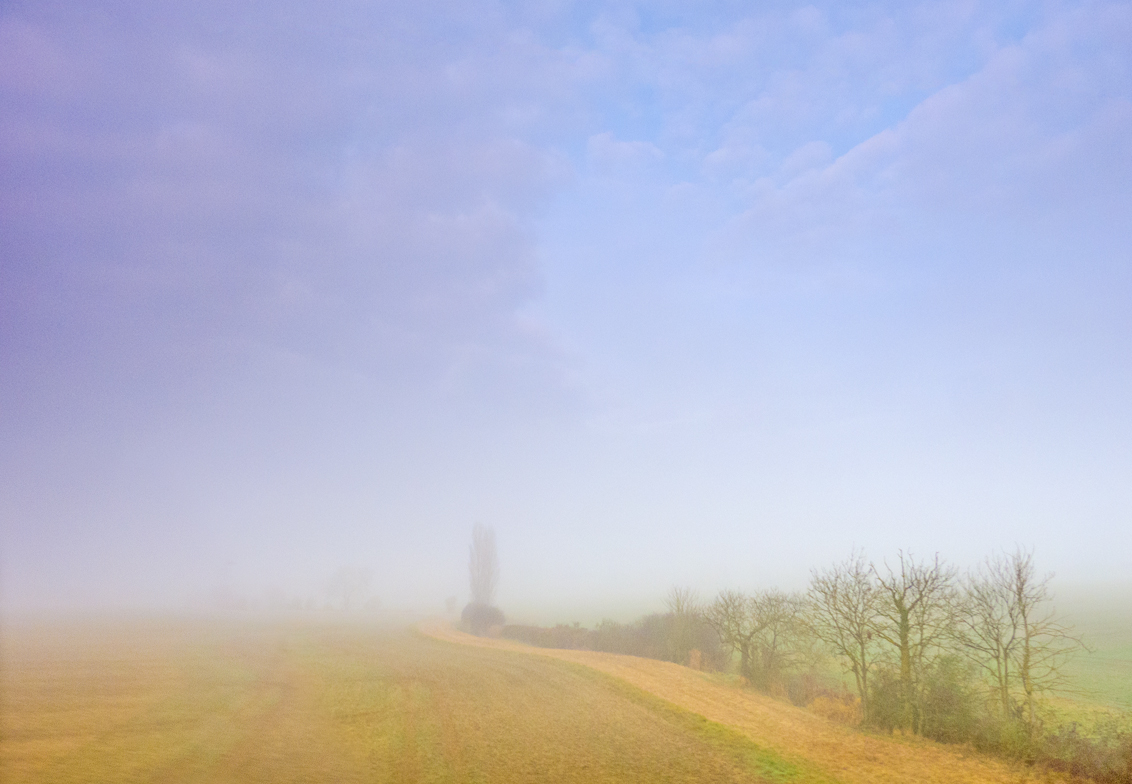
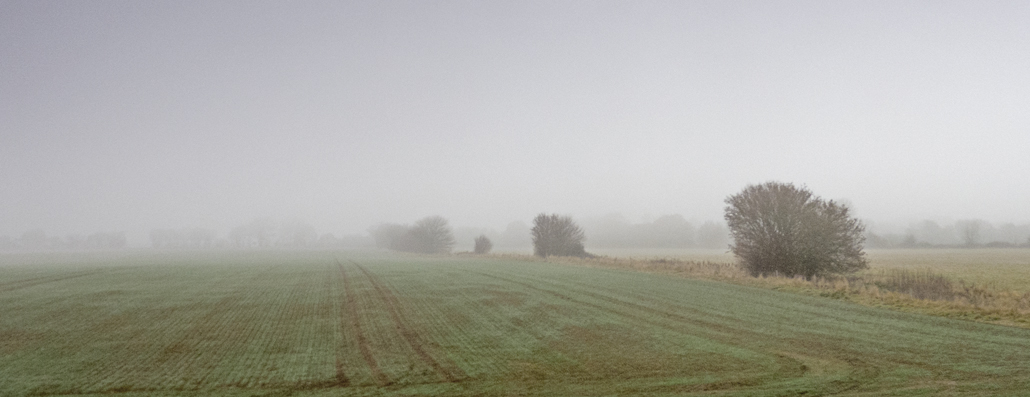
All the usual features just vanished into the misterious fogginess and thus looked strangely and dramatically different from their usual appearance…
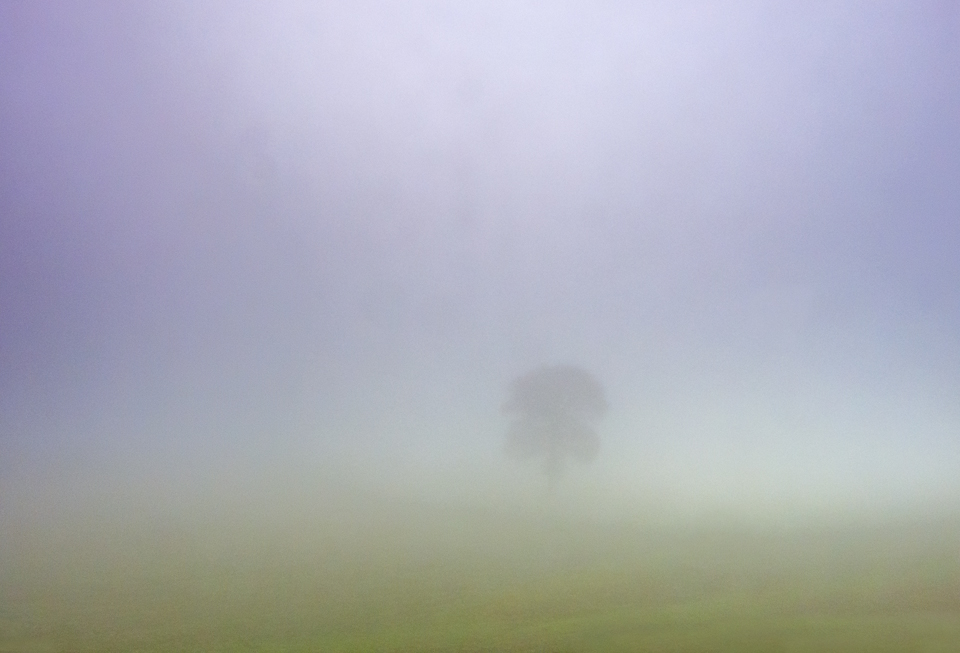
Even humdrum views developed a new dimension, such as the fields west of Witham, or the Lone Oak east of Shenfield:
The next day saw less fog but more dramatic skies, even with blues skies – for a brief moment – before the clouds once again began to obscure the sun:
The Lone Oak east of Shenfield looked particularly dramatic:
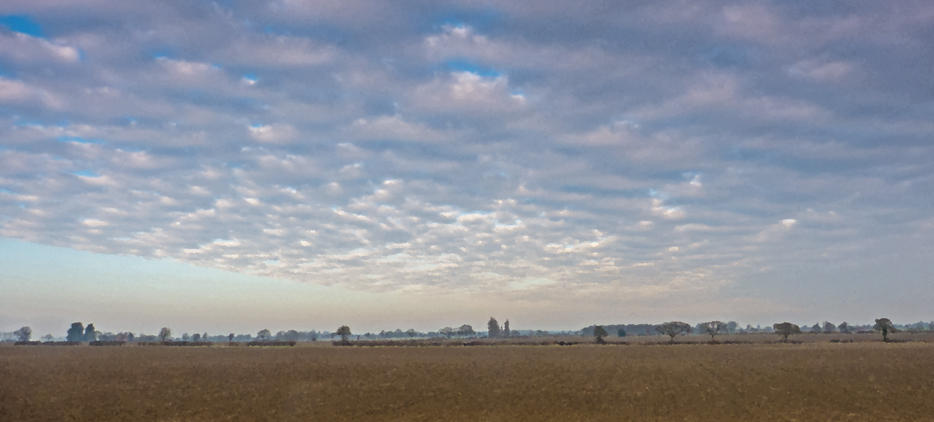
Over the next few days things became somewhat foggy again first thing, but generally brightened up with rather dramatic skies as the morning wore on:
…giving the views towards Galleywood, Billericay and the Lone Oak a particularly striking atmosphere:
Mid-December was pretty miserable, with driving rain sweeping in from the west up the Colne Valley:
Things remained pretty much the same all the way to Chelmsford and the poplar fields at Ingatestone:
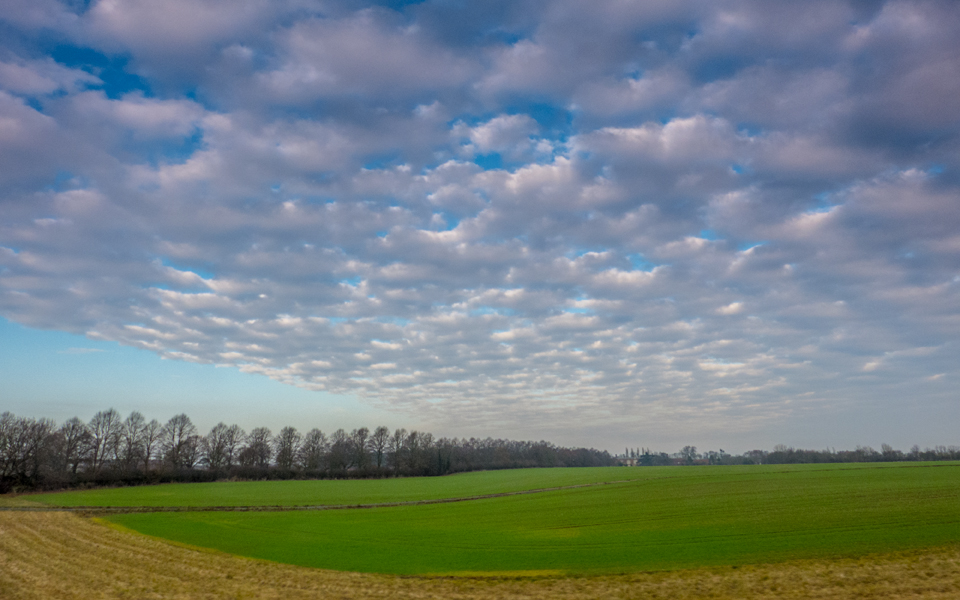
Then a distinct change in the weather on 20th December, with a front passing through as altocumulus drifted away eastwards, gave clear blue skies for the first time in many days:
The view over New Hall School, just east of Chelmsford, promised a period of clearer skies but probably much colder ground temperatures (without the insulating layer of cloud):
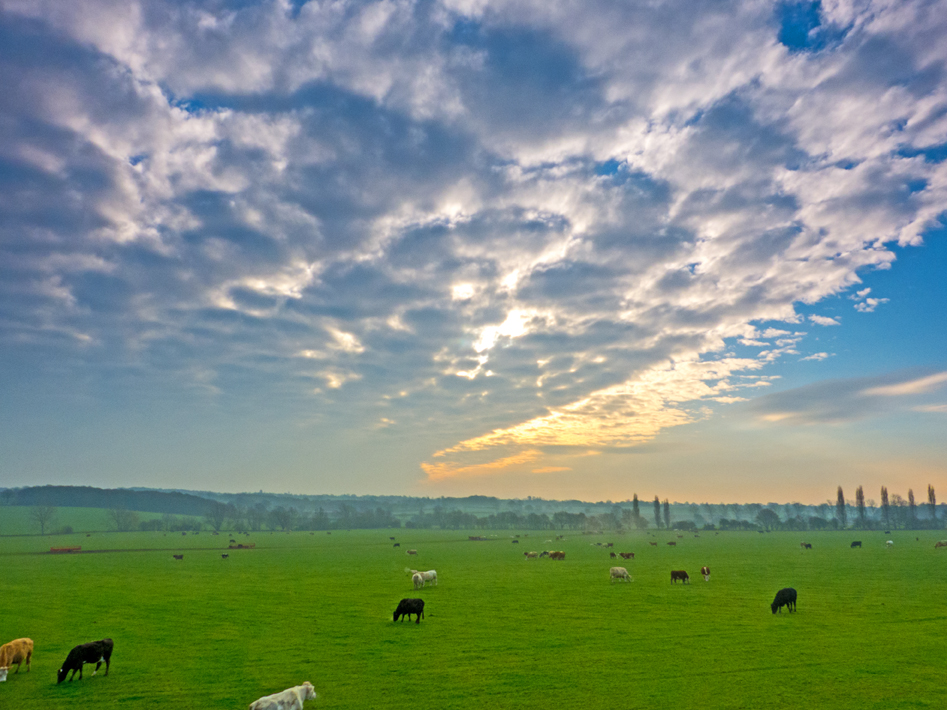
While the cows in the fields west of Chelmsford breathed steam into the cold morning air:
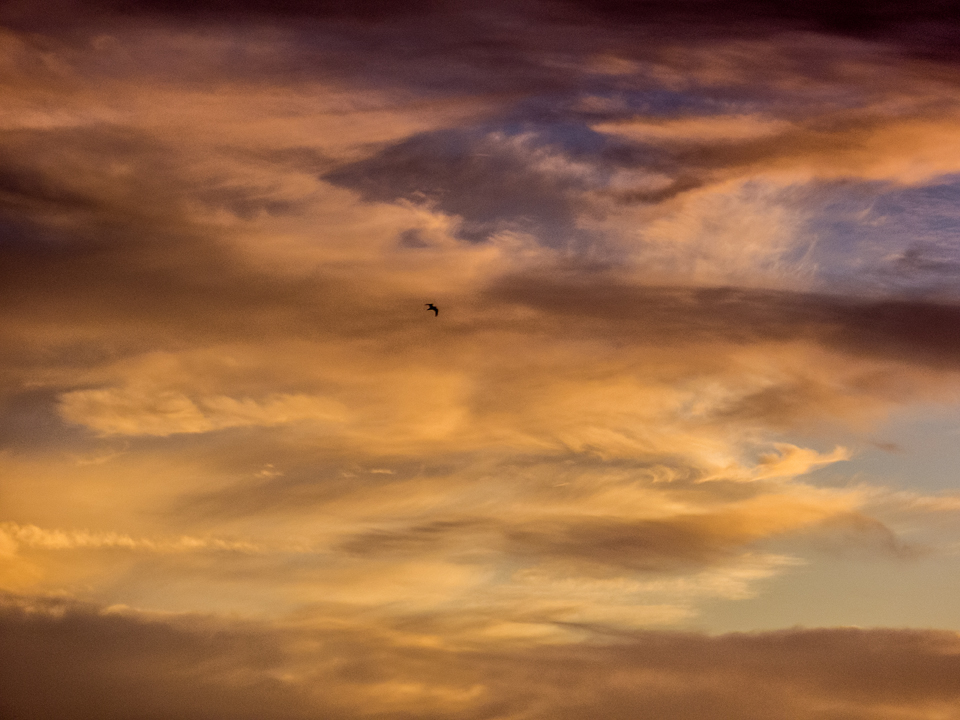
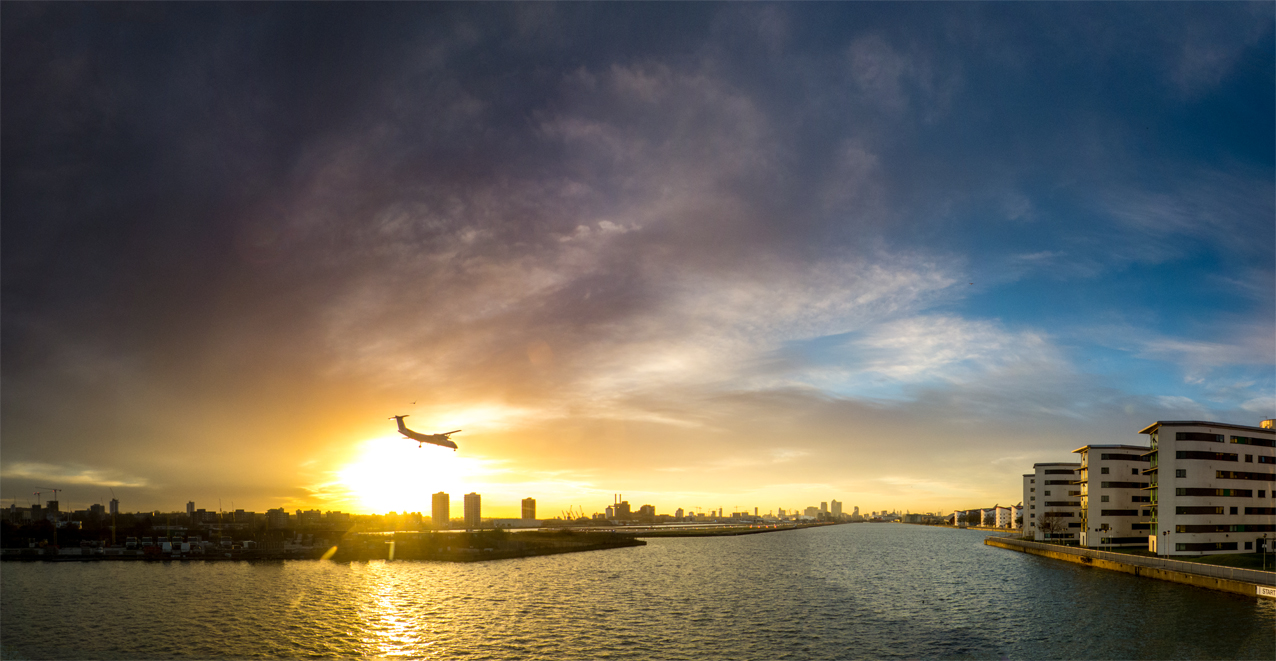
Then on 22nd December the skies cleared, the wind dropped, but the sunset hinted at wilder things to come as Storm Barbara (Storm Barbabra…??? Barbara is the name of a favourite auntie, not a killer storm, but then I’m no meteorologist so I bow to their more profound insight……….) swung towards the UK like a slingshot. This meant that sunsets over London City Airport were beautifully dramatic. I was joined on the Beckton road bridge by a father and 8-year old (?) son who had apparently been there all day photographing the planes coming into City Airport. My heart went out to the small boy forced to watch planes all day as his father captured the landing planes in “the perfect photograph” – that is until the next plane came into land. I had opened sympathetic discussions with the young boy about Sopwith Camels, SE5as, Spads and Spitfires when he commented dismissively that he “mainly liked modern jets” before photographing the next plane to land. He then corrected his father about the nature of the recently-landed jet, particularly with regard to its normal flight endurance and suggested that the most likely point of departure was Zurich. Clearly I was in the presence of an aviation expert, particularly as the father quietly observed to me, “I’m hoping that we can head off home soon – I’m freezing after being here all day.”
The sunset clouds really were rather glorious:
So I left the father and son duo capturing the final flights of the evening and headed off to Gallion’s Reach DLR Station and thence homewards:
Introduction
There is much talk nowadays of ‘going on a journey’, or ‘being on a journey’. Peatland restoration is often referred to in such terms. Some of you will know that I own a very small boat called Merlin, and it does seem to me that restoration and restoration monitoring are far more similar to a sailing voyage than any journey on land. To begin with, there are no roads at sea. Just as every site has its own unique characteristics, its own history and its own future trajectory, so every voyage is unique. Many boats may follow the same general route but none will take exactly the same course – unlike following a road or pathway on land.
The Passage Plan
At sea, the first step of any voyage is the passage plan. This involves careful consideration of initial conditions and anticipated circumstances en-route in order to establish the course to be followed for a safe and viable voyage. The passage plan is not, however, a fixed map. The plan sets out a series of courses and course changes which appear to offer the best hope of completing the voyage successfully and safely, but which ultimately may or may not be followed because conditions at sea may prove to differ from those anticipated. The passage plan familiarises the navigator with fixed points along the proposed route, brings into play known variables such as tide height, tidal currents, forecast wind-speed and direction. It may also define alternative safe courses in the event that prevailing conditions should change.
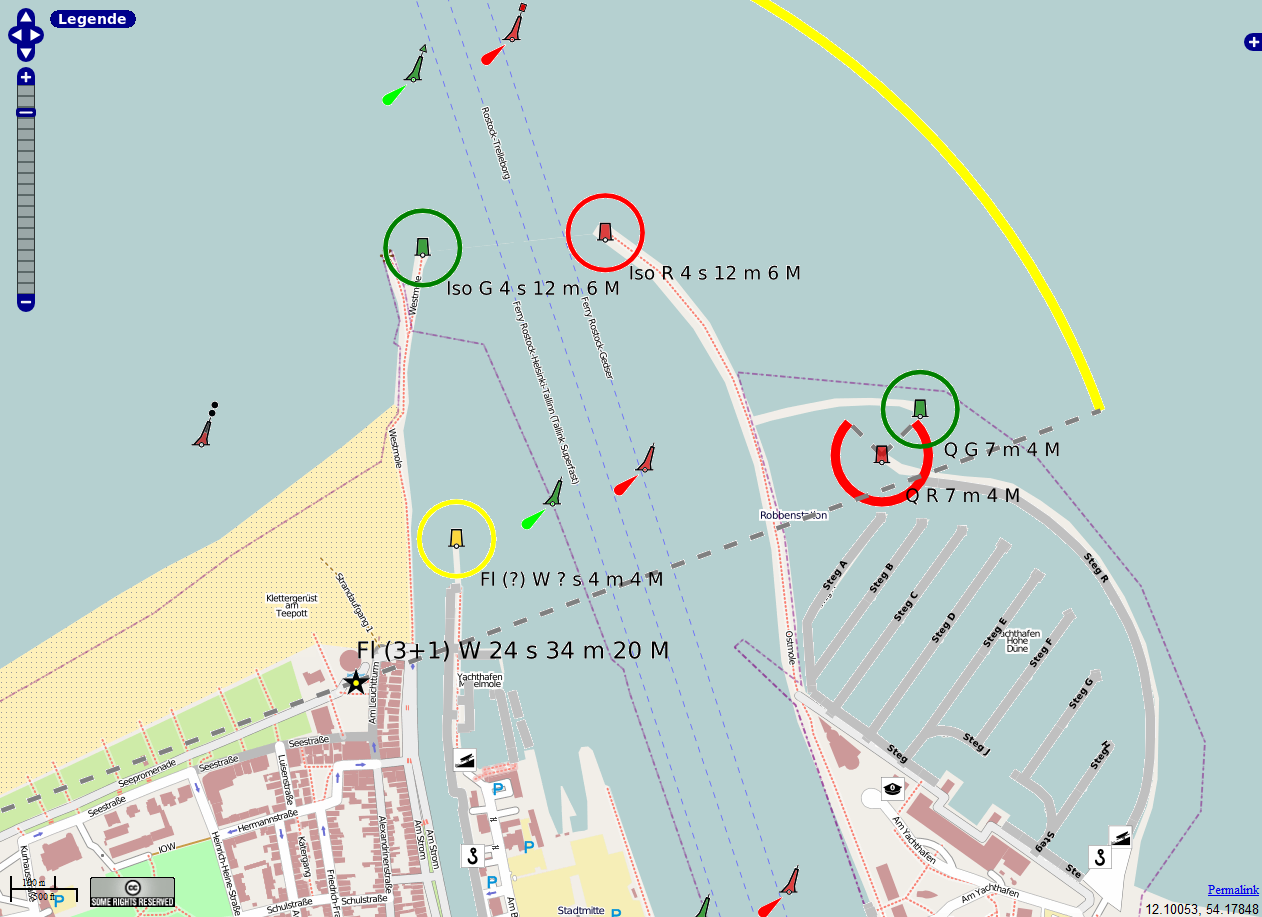
The key thing about a passage plan is that it starts from a fixed known point. This is almost the only certain thing about the plan. Virtually everything after that is based on the circumstances likely to be encountered. The starting point is established using navigation charts – in the case of the UK these would be Admiralty charts. In the US the NOAA provides similar charts. Navigation charts provide a precise position for the point of departure, be it harbour or mooring point, and provide valuable indicators for navigational progress from that starting point – indicators such as leading lights, buoys and other navigational marks.
Example of navigation features and marks which must be negotiated during departure from harbour. By die Mitarbeiter der beteiligten Projekte (OpenSeaMap) [CC BY-SA 2.0 (http://creativecommons.org/licenses/by-sa/2.0)], via Wikimedia Commons
Every peatland restoration programme has a starting point. If habitat restoration is to be undertaken it is reasonable to assume that the site is not currently in good condition, but what exactly is its condition? How is this starting point defined and described? Reading the descriptions of study sites published in scientific journals is a sobering experience. A high proportion of descriptions go no further than assigning the site to an NVC type and accompany this with statements such as “the site has been drained”. Although many of the early ecological papers such as Godwin & Conway (1939) or Ratcliffe & Walker (1958) provide photographs of their study sites, this has become a rare feature of journal papers despite the increased sophistication in visual recording and publishing technology. The use of VR technology should in future even allow readers to have a virtual visit of a study site, but at present such detailed site information appears to be on the wane rather than expanding, a state of affairs which I find both baffling and frustrating.
This should also be a source of profound wider concern, particularly as a brief survey of the audience during my talk revealed that no-one believed the NVC to be sufficient for describing the condition of a peatland site, and only a single person (albeit someone with considerable experience) believed that the Common Standards Monitoring (CSM) scheme for peatlands was sufficient for defining the condition of such sites. Yet these are the ‘standard’ tools by which peatland sites in the UK are described. If there is little or no confidence in these tools, how then is the one fixed point on a restoration (or research) voyage to be defined – namely the starting point? What can be used to provide the accuracy and confidence offered by an Admiralty or NOAA chart?
Without the equivalent of an Admiralty chart, it is not possible to define adequately the starting point of any restoration programme, nor to interpret adequately any research data obtained for the site.
By Marine Chart Division, National Ocean Service, NOAA [Public domain], via Wikimedia Commons
The fault does not lie with the NVC, which was developed as a means of categorising the whole spectrum of British vegetation rather than defining condition-states within given vegetation stands. Nor is CSM at fault, because this was developed to identify broad levels of condition which could be assessed rapidly. The fault lies, perhaps, in the assumption that these two descriptive systems are adequate for defining the starting condition of specific sites which are under restoration management or investigation. The IUCN Commission of Inquiry Report has illustrated a set of condition states, but these are somewhat generic (Bain et al., 2011), while I have set out one approach by which site condition can be described more precisely (Lindsay 2010, Appendix 3), but much work remains to be done. Unfortunately, such ‘descriptive’ research does not readily attract research funding so it is difficult to see how development of suitable descriptive systems is to be achieved.
Tides, tidal currents and the shipping forecast
Every voyage has a starting time, and this is often dictated by the state of the tide. Tides are almost the only other certainty within a passage plan because tidal rise and fall for a number of reference ports is a well-established set of data. The precise tide heights and timing for any given day are available from tide-tables published annually for the set of reference ports. The navigator adjusts the height and timing of the tide according to the position of the departure point in relation to the nearest reference ports. It is therefore also important to know the exact location of the departure point in relation to these reference ports otherwise the boat may run aground or be unable to cross a harbour bar.
In the case of our restoration voyage, there may be reference sites against which any monitoring data can be compared, but such comparison only makes sense if the relative condition of the restoration site can be compared effectively with the condition of these reference sites. If the condition of the reference sites is also ill-defined, comparison becomes even harder and potentially more misleading.
On setting out from port on our sailing voyage, we then encounter our next challenge. The thing we are travelling over is itself moving! Tidal currents mean that although we may have a desired trajectory, the tidal current influences our trajectory and may result in us following a somewhat different course to the one we had planned. We anticipate this in our passage plan by referring to a tidal stream atlas. This tells us the direction and strength of the tidal current at different states of the tide – states which are determined from our tide tables and calculations relative to our reference ports. A tidal-stream atlas is less definitive than the tide tables because at any given location at sea there may be localised eddies and other disturbances which can mean that the local current differs from the overall pattern of the tidal stream. Published pilot books can give warning of some well-known anomalies but local conditions on the day can generate such a wide variety of effects that the passage plan can only allow for the most well-documented anomalies. The only practical way of allowing for such local variations is to ensure that a constant watch is made of the boat’s progress during the voyage.
Having decided to sail on a given state of tide, the next factors to take into account in the passage plan are the likely windspeed and direction. These are obtained from the shipping forecast, but unlike the dependable predictions of tide tables and tidal atlas, the shipping forecast can give only the most general indication of anticipated weather conditions. The true conditions will only become evident once the boat leaves the protection of the harbour. It is therefore absolutely vital that accurate readings are taken of the conditions once in the open sea to enable appropriate adjustments to be made to the passage plan. The wind direction may mean that a different course must be adopted in order to make progress, or the direction and speed of the wind may mean that there is a tendency for the boat to drift off-course downwind. These factors, determined by noting the boat’s position over time, may have a major influence on navigational decisions, being used to anticipate our likely course made good as we round critical headlands – rather than being swept onto them. Our new ‘course steered’ makes allowance for these influences, ensuring that our ‘course made good’ follows the desired trajectory.
A plotted course, illustrating the distinction between the ‘course to steer’ and the resulting track, or ‘course made good’ over the sea-bed, because the mass of moving water forming the tidal stream drives the boat south while it attempts to sail east.
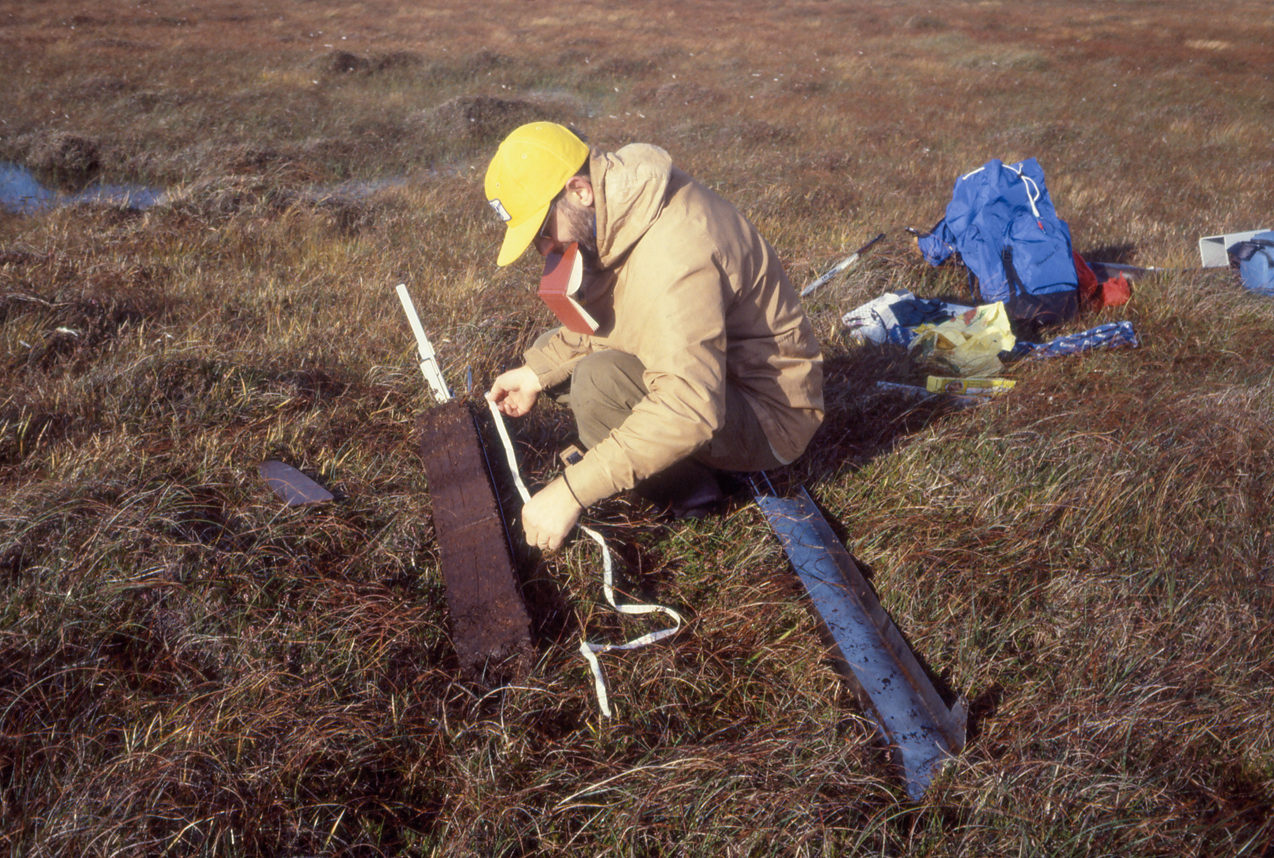
Similarly, every peatland site already has both an underlying trajectory as well as a set of short-term responses before ever we begin any restoration management. It has its own tidal stream. There are no tidal stream atlases for peatlands but there is the peat archive, which provides a record of what the site has been doing for the past few thousand years. How often is this used – even to examine just the past century or so – as a means of assessing a site’s current trajectory? There is a natural tendency to assume that the current vegetation is what has existed on the site for some time but often a core taken from the uppermost layers of peat will reveal that a very different vegetation was present until quite recently.
Bill Shotyk sampling the uppermost layers of a peat core taken in Shetland to examine the recent record of lead deposition.
On other occasions a vegetation type may be assumed to have resulted from recent impacts but this assumption may be shown by the peat archive to be incorrect, with the evidence of the peat core revealing that the present vegetation has characterised the site for many centuries or even millennia. Current concerns about Molinia caerulea, for example, may reveal that in certain locations this species is indeed a recent coloniser and is associated with much charcoal resulting from burning, whereas in other locations the archive may reveal that Molinia has been a constant feature for millennia because this is a natural zone of water collection and movement.
Considering the overall direction of the restoration voyage, most areas of peat bog will have an underlying tendency to return to peat bog conditions because this demonstrably is what has prevailed on the site, often for several millennia. This overall tendency can only be deflected by the input of energy, whether in the form of, for example, peat cutting, drainage or burning. Such influences may have an influence lasting centuries in some cases, adding complexity to the underlying trajectory of the bog system, but on cessation of such pressures the bog will generally demonstrate a tendency towards resumption of peat formation. Immediate pressures such as trampling through overgrazing, or even responses to restoration actions, may impose a further set of influences on the trajectory of the bog. These will inevitably interact in much the same way that shifting wind directions and swells from distant storms influence a boat’s course from hour to hour and require careful adjustments of the course to steer in order to be sure that the boat, or bog, follows the desired track. The underlying direction of travel and general character of the original natural state can nevertheless often be determined by even a relatively simple analysis of the peat archive. This is a feature almost unique in terrestrial habitats yet one which is rarely used as a guide.
Navigation is essential for the entire duration of the voyage
Having passed safely beyond the harbour entrance, a wise skipper does not then announce, “The last cardinal marks of the harbour entrance are now astern, the bows are pointing roughly towards the Scillies, so let’s stow away all the charts and continue on this course based only on dead reckoning and hope that we eventually arrive safely in St Mary’s harbour”. Yet this is what generally happens with peatland restoration. Restoration research and monitoring is geared to three, four or, at most, five-year funding programmes. When the funding ends, so does the work, but without ongoing monitoring it is impossible to identify the course subsequently being taken by the site.
In sailing navigation the complexity of the various interactions resulting from the tide, the tidal stream, wind direction, wind strength, the boat and its rigging, and even the skill of the crew, make it vital to determine the boat’s position throughout the voyage in order to ensure that the boat is not drifting off into potential danger. Simply pointing the boat vaguely in the right direction at the point of departure and trusting for the remainder of the voyage only on measurements taken from a boat which is moving through two media which are also moving (wind and water) is the height of folly. Although it is possible to measure wind direction, compass heading and speed through the water accurately while under way, these measurements alone are of limited use to the navigator and become less so as the voyage progresses because it is the ‘course over the ground’ which is the critical thing. These measurements need to be put into some sort of navigational context. An ‘estimated position’ (EP) can be plotted based on the direction and apparent speed of travel for a given period of time – a process known as ‘dead reckoning’ – but the errors resulting from tidal influences, leeway and poor steering compound and multiply over time and can mean that the EP is a considerable distance from the actual position. It is essential that the true position of the boat be determined repeatedly throughout the voyage in order to make sense of the measurements obtained from the navigation instruments. Only by combining these values with a known position is it possible to judge whether the tide is pushing the boat off course, or the wind is causing significant sideways leeway drift, or the helmsman is simply being inattentive.
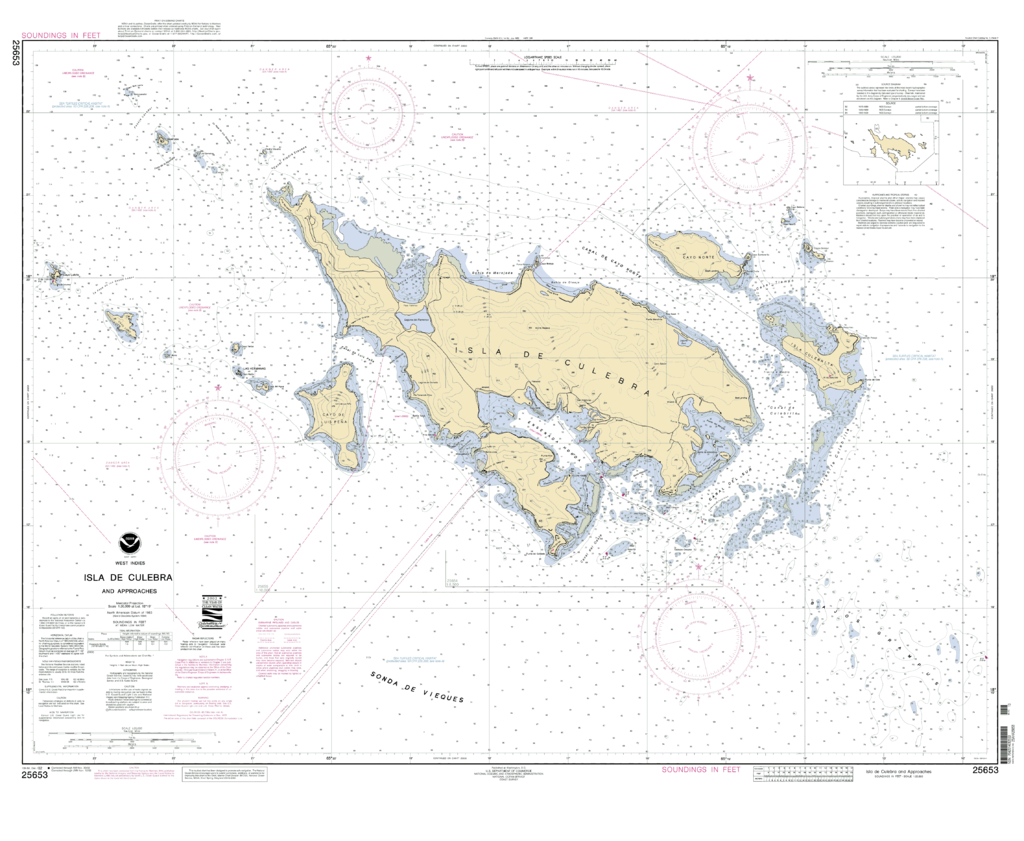
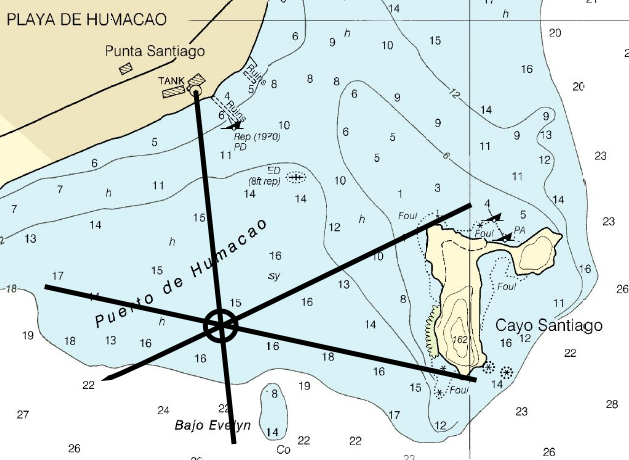
No competent skipper would therefore dream of attempting a voyage based solely on dead-reckoning because the imponderables are too many and varied. Instead, navigators rely on ‘fixes’ taken at regular intervals based on identified fixed points – a headland, a distant church spire, the sun at noon, or the stars – in order to confirm the boat’s position on the chart. Today, of course, GPS is commonly used to determine position, but the process is essentially the same as traditional fixes because the satellites have become the known points. The calculated ‘course to steer’ is then combined with dead reckoning to keep the boat roughly on course until the next ‘fix’, but if we have no chart how is a ‘fix’ ever to be obtained?
Establishing a navigational ‘fix’ using bearings to three identifiable charted points. By U.S. NOAA (Cayo_Santiago-chart.png) [Public domain], via Wikimedia Commons
A fix can only be obtained by reference to the navigation chart, but if we have no chart, how is a fix ever to be obtained? This is one of the key challenges facing peatland restoration and monitoring. It is possible to measure, for example, hydrology, gas flux or water chemistry but without some reliable chart of ecological condition such measurements can only provide a form of dead reckoning which merely positions the site relative to its (generally ill-defined) starting-point. It is not possible to judge where this estimated position lies in relation to the desired course towards a restored condition unless this EP can be fixed using a chart of ecological condition.
The start is often confusing and progress may not follow the shortest route
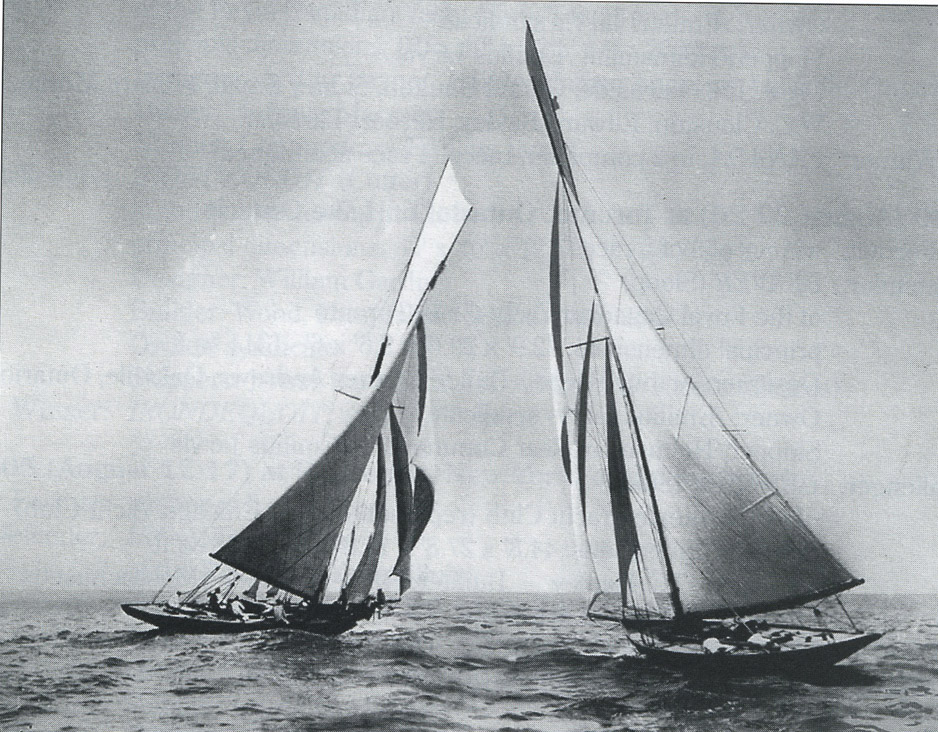
On casting off from the starting point, the chart then highlights features relevant to navigation which will be encountered first. The initial stages of a voyage are rarely a true measure of the voyage ahead – indeed these early stages can seem somewhat chaotic as things are adjusted and everyone becomes familiar with, and settles to, their respective tasks. Only after passing beyond the protection of the harbour is it possible to determine the actual sea state and the true strength and direction of the wind. Based on this, the appropriate setting of the sails can be determined, a course appropriate to the conditions decided upon, and the crew can then begin to settle into their respective roles. On sailing beyond the breakwater the boat may, for example, encounter an unexpected headwind combined with a confused cross-sea, meaning that for a while the boat is forced to tack back and forth to make any progress. At any given moment the boat may seem to be heading in completely the wrong direction
The yacht Canada (left), skippered by Aemilius Jarvis, crosses tacks with Vencedor” on Lake Erie, near Toledo, Ohio, in the 1896 match-racing series from which “‘Canada emerged the victor. Both yachts are aiming for the same finish line but are currently sailing in very different directions because they are tacking in order to make progress to windward. By Royal Canadian Yacht Club Archives (Royal Canadian Yacht Club Archives) [CC BY 3.0 (http://creativecommons.org/licenses/by/3.0)], via Wikimedia Commons
Similar confused conditions may be found in peatland restoration, particularly immediately following restoration actions, but the nature, direction and duration of such responses cannot be identified clearly unless charted positions can be established repeatedly for this transitional phase. Just as when a sailing boat is tacking, at any one moment the site may appear to be heading in completely the wrong direction but repeated fixes gradually establish that the site is indeed making progress along the desired course. Without such fixes, monitoring results may appear confusing and even counter-intuitive – indeed a short period of measurements may present entirely the wrong picture of overall progress.
It is therefore important to have a series of fixes which have been taken over an appropriate span of time relative to the overall voyage before any conclusions are drawn about responses to restoration actions. The first few years, or even the first one or two decades, may see the system experiencing a period of settling down where perhaps nothing seems to be happening for a time, or conditions even appear to be deteriorating further, or heading in unexpected directions. Under such circumstances it is important to recall that even 100 years is a very small time-frame within the ‘life-span’ of a bog. If the habitat were a forest under restoration management, the concept of reserving judgement on progress for a decade or two would excite little comment. It is reasonable to apply the same approach to peat bog systems because many have already enjoyed much longer ‘life spans’ than most surviving forests.
Measure the right things
It’s also vital when monitoring the progress of a voyage to ensure that the correct things are measured. There is an important difference between ‘course steered’ and ‘course over the ground’. A classic error in sailing is instructing the person at the helm to keep a navigation point “on the starboard bow” in order to clear a headland but fail to give an associated compass heading. The person on the helm duly keeps the navigation mark to starboard but does not realise that the boat’s heading is changing all the time because the boat is being swept to starboard by the tidal stream and will soon be on the rocks of the headland. Similarly, it is all very well monitoring the behaviour of the water table but if the ground surface itself is subsiding then measuring the water table alone does not tell us what we need to know about overall impact.
Being some 90% water in composition, when peat is dried it shrinks, and the more decomposed it is the more it shrinks. Peat which is relatively un-decomposed (e.g. H2-3 on the von Post scale of humification) shrinks by only a modest amount when dried because there are many long fibres which help to retain the overall matrix shape, whereas peat which is high decomposed (e.g. H8 on the von Post scale of humification) can shrink by as much as 50% when dried.
Peat cores for differing degrees of humification, originally 50 cm long, following extended air drying. (Top) H2-3, (Centre) H5-6, (Bottom) H8.
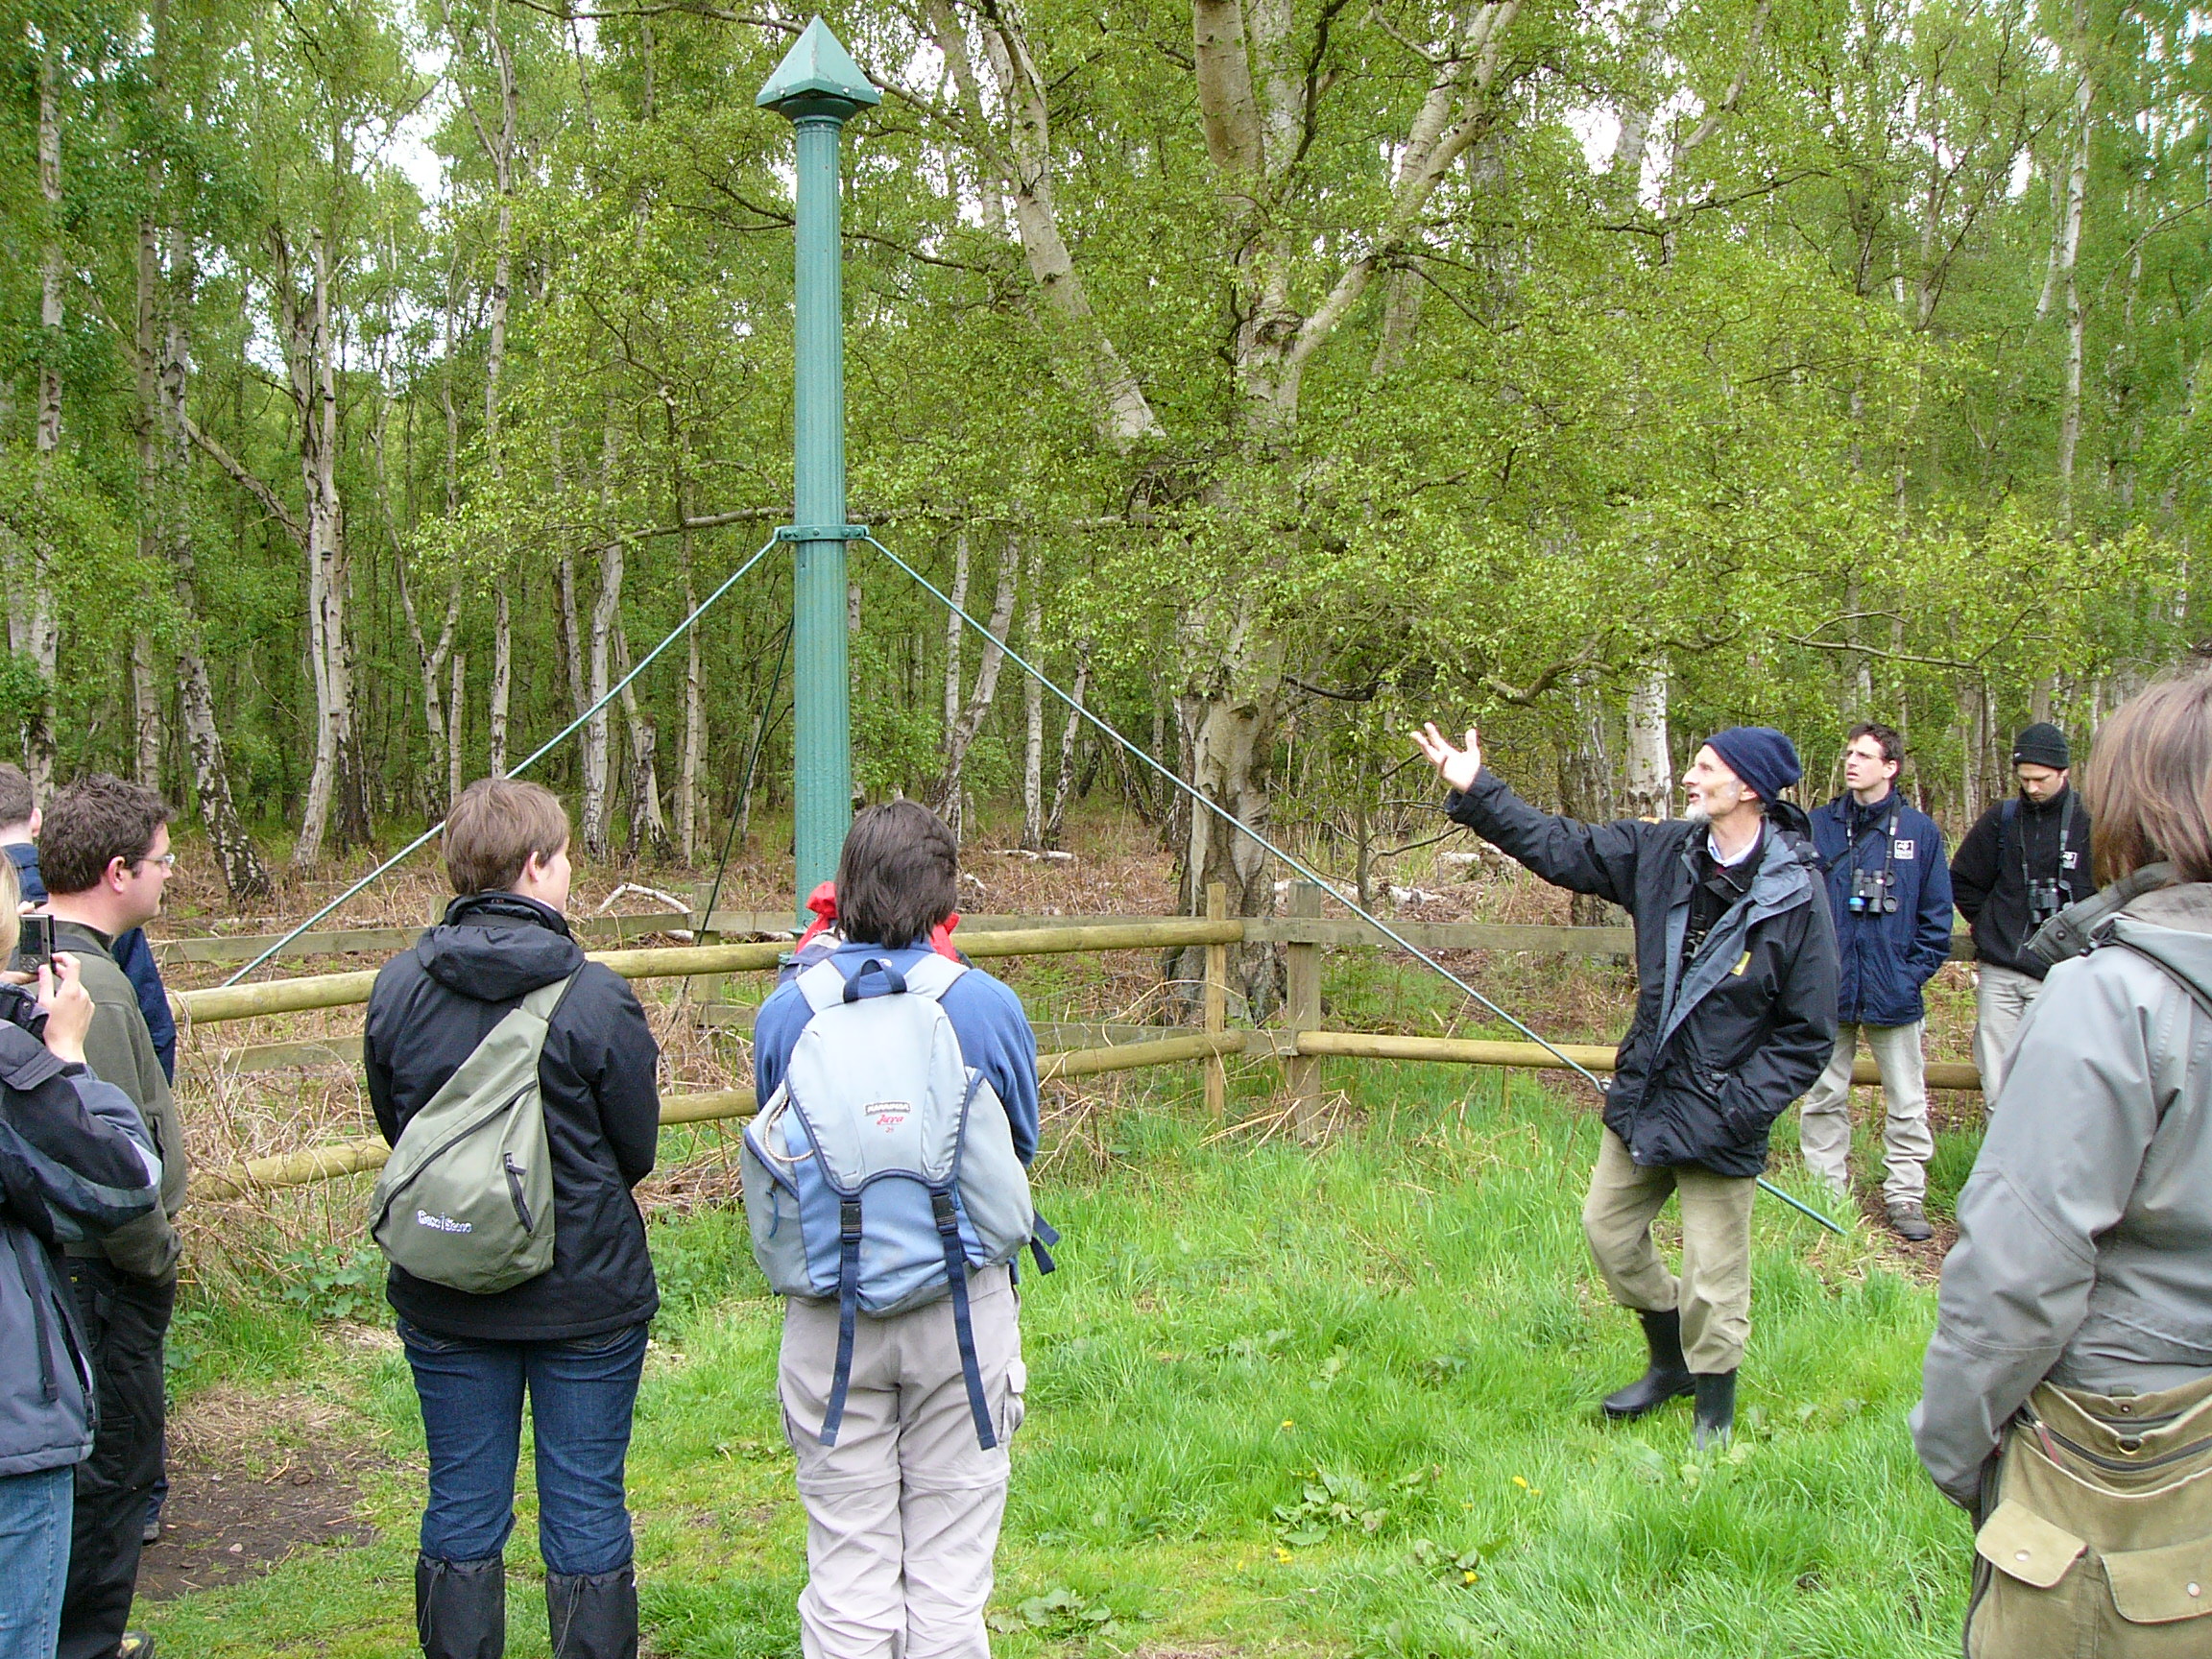
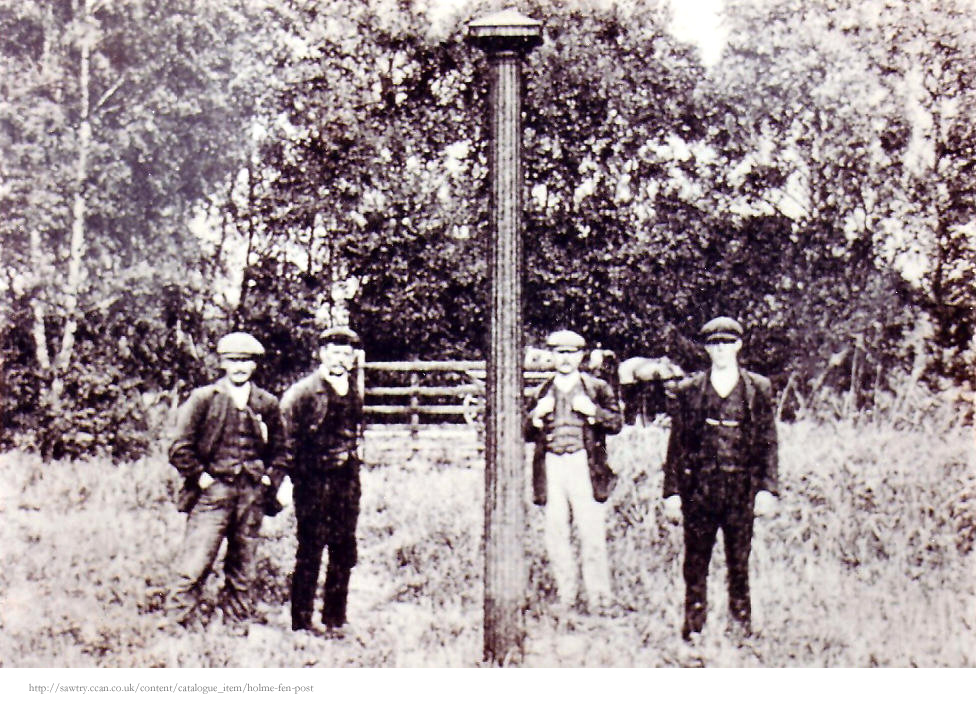
The ultimate example of shrinkage resulting from drainage is the Holme Fen Post in Cambridgeshire. This cast-iron pillar taken from the Crystal Palace Exhibition was sunk into the raised bog of Holme Fen in 1848, just prior to drainage of the last great Fenland meres – Whittlesea Mere – adjacent to the raised bog. The post was attached to a constructed base embedded in the mineral soil beneath the peat, positioned in such a way that the cap of the post was level with the raised bog surface in 1848. The surface of the bog has subsided by more than 4 metres during the intervening 170 years.
Alan Bowley, recently-retired Natural England Site Manager for Holme Fen, indicating the degree of shrinkage at the Holme Fen Post since the 1850s.
Thus it is important to recognise all the relevant forces which are acting on a peatland site both before it undergoes restoration and then subsequently after restoration begins. Monitoring just one or two of these relevant forces while ignoring other key forces, especially if they are slow-acting, can mean that crucial information is missed and a distorted view of responses is obtained.
Time and duration – vital elements of navigation
Time and duration are as relevant to sailing voyages as they are to restoration management. Time of day defines the state of the tide whereas time since departure gives an indication of the progress made along the planned course, as well as how much further there is still to go. Sailing voyages are generally shorter than peatland restoration voyages. The Holme Fen Post highlights the fact that navigation for a restoration voyage can mean establishing a monitoring system to measure system responses which is capable of being used time and again over periods of a century or more.
Photographs, such as the one shown below for the Holme Fen Post taken in the late 1800s, provide a (reasonably) reliable objective and repeatable method of recording certain aspects of such system responses. But to what degree can this be said of other monitoring approaches? Any monitoring system intended to provide evidence of responses 50 years hence must be capable of being repeated in a consistent way in 50 years’ time and must also be capable of analysis and interpretation in a manner which is consistent with the original baseline survey. Without such consistency, the two sets of data represent two independent (and potentially incompatible) surveys undertaken 50 years apart, rather than representing two fixed points on a single voyage. Furthermore, the data need to survive for 50 years, rather than being lost, or trapped on some storage medium which can no longer be read.
The Holme Fen Post photographed in 1910.
Funding-support systems for peatland monitoring are simply not geared to the type of long-term monitoring which is needed and which is exemplified by the really very simple but very effective long-term monitoring demonstrated by the Holme Fen Post. Current funding systems are similar to the skipper referred to earlier who, having safely negotiated the harbour entrance, points the bows towards the distant landfall then simply throws the navigation charts overboard and announces that, because there was no money to pay a navigator or indeed to purchase any navigational instruments, no further navigation will be required for the remainder of the voyage. This would be unthinkable for a sailing voyage. It is difficult to see how it is more acceptable for a peatland restoration programme. At the very least, robust monitoring systems need to be put in place at the start, and these systems need to be as robust as the Holme Fen Post. Specifically, they need to be systems which can be re-visited and measured effectively whenever a funding opportunity presents itself.
Monitoring the effect of monitoring – a particular peatland problem
Peat bogs are systems which are extremely sensitive to trampling and to solute inputs. It is therefore also important to ensure that the process of monitoring does not itself alter the system. In sailing, for example, a classic mistake involves taking a compass bearing while standing next to a large piece of metal such as a mast fitting, thereby ensuring that the bearing obtained is incorrect but without any obvious warning-sign that the bearing now being used for navigational decisions is false and perhaps dangerously misleading.
As an example of the same problem in peatland monitoring, a transect which we established on Coladoir Bog, on Mull, in the 1980s made use of discarded wooden road barriers in order to permit us to monitor our transects without causing trampling damage to the adjacent bog surface. Unfortunately, we did not realise at the time that the timber had been treated. Leaching of the treatment compounds subsequently killed the only recorded colony of brown-beaked sedge (Rhynchospora fusca) on the site…
Fiona Everingham monitoring the brown-beaked sedge (Rhynchospora fusca) transect on Coladoir Bog, Mull, 1985.
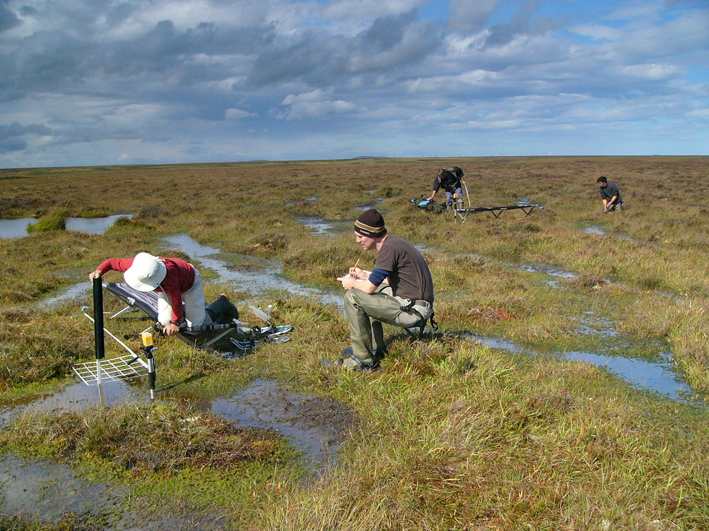
Such impacts – though particularly trampling impacts – can very quickly mean that one is, in effect, monitoring the impact of monitoring rather than monitoring the impact of restoration management. This is particularly true of peatland because of their sensitivity to repeated trampling. Consequently, we now use snowshoes around any fixed transects we establish and use folding camp-beds on which we stand or kneel while recording these transects.
Fiona Everingham and Stuart Connop recording a fixed transect on Munsary Peatlands, Caithness, using snowshoes and a folding camp-bed. In the background, John Riggall and Jack Clough are setting up the camp bed for another transect.
Do improved measurements mean improved monitoring?
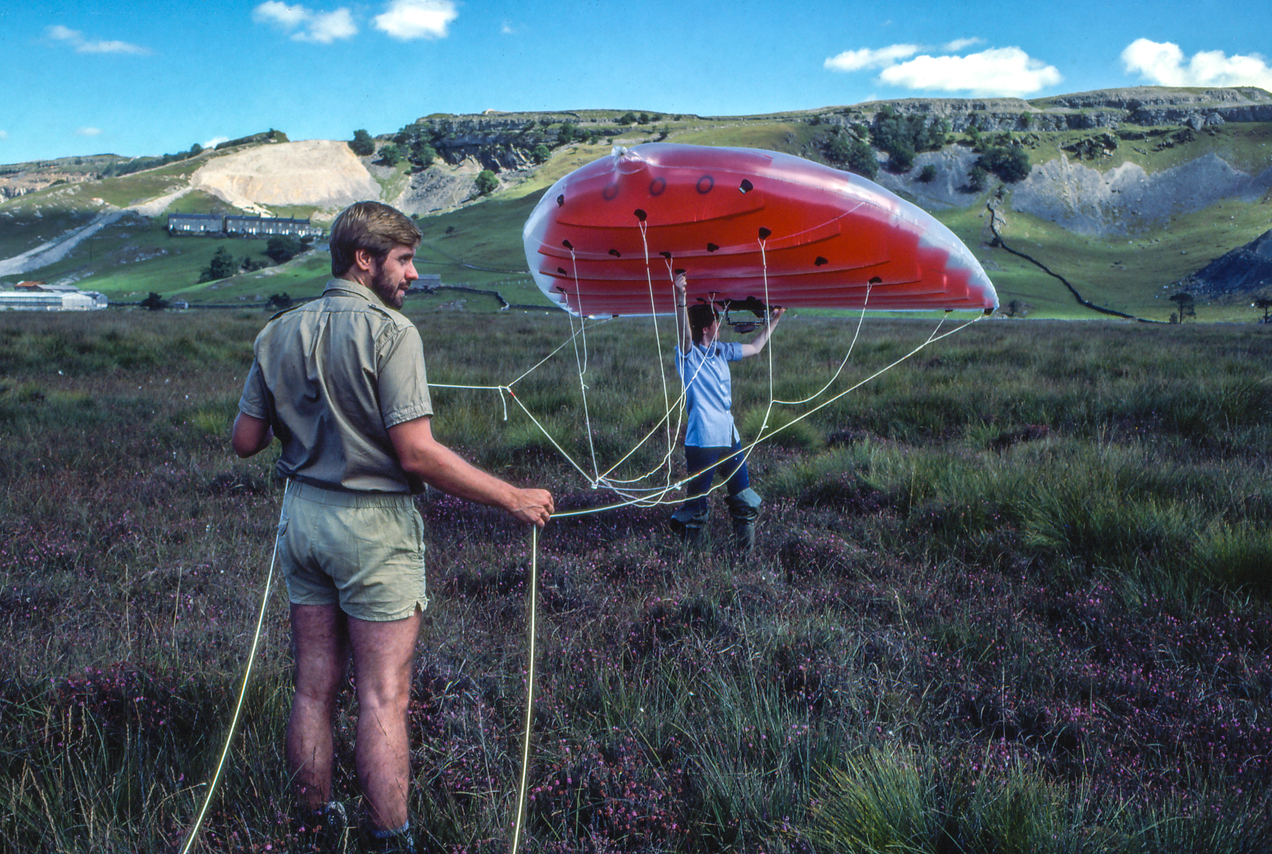
Assuming that pitfalls such as trampling and solute inputs can be avoided, the technology to record change is constantly improving. Thus, old R16 water-level recorders using paper charts on a clockwork drum have been replaced by modern pressure sensors and data-loggers. The fuzzy images from LANDSAT 4 have been replaced by the crisply detailed images available from Google Maps and what3words.com ESRI satellite view. Drone technology has advanced enormously since the use of helium-filled meteorological balloons or ‘inflatable kites’ with cameras slung precariously beneath.
R16 water level recorders installed on Glasson Moss, 1980.
John Riggall and Fiona Burd prepare a Stewkie inflatable camera kite for low-level aerial photography on Helwith Moss, 1982.
But while detailed measurements can now be obtained from a wide array of sophisticated instruments and mapping of peatland systems is possible to centimetre accuracy using drones and Lidar, does this necessarily mean that we can interpret these more detailed results more intelligently? If we cannot define precisely where we are on our chart – i.e. the precise state and condition of our peatland – how can we tell what these detailed measurements mean in terms of progress along the restoration voyage?
I fear that while we may be obtaining more and more impressive types of data, this improvement in data gathering has not been matched by improvements in the tools needed to interpret these data, specifically in terms of the ecological continuum from degraded site to a fully functioning and ‘restored’ site. We have neither the tools, nor often the duration of funding, required to ‘fix’ our position on our voyages of restoration. At present we are setting out from an unknown starting point, navigating on the basis of ‘estimated position’ for the first 3-5 years, then often abandoning all attempts at navigation (because the funding has ceased), or attempting to complete our restoration voyage using dead-reckoning alone, because we have no charts capable of enabling us to obtain a true ‘fix’. Until we have good reliable charts, I fear that we will remain ‘all at sea’…..
References
Bain, C.G., Bonn, A., Stoneman, R., Chapman, S., Coupar, A., Evans, M.,Gearey, B., Howat, M., Joosten, H., Keenleyside, C., Labadz, J., Lindsay, R.,Littlewood, N., Lunt, P., Miller, C.J., Moxey, A., Orr, H., Reed, M., Smith, P.,Swales, V., Thompson, D.B.A., Thompson, P.S., Van de Noort, R., Wilson, J.D.& Worrall, F. (2011) IUCN UK Commission of Inquiry on Peatlands. IUCN UK Peatland Programme, Edinburgh.
Available from: http://www.iucn-uk-peatlandprogramme.org/resources/188
Godwin, H. and Conway, V.M. (1939) The Ecology of a raised bog near Tregaron, Cardiganshire. Journal of Ecology, 27, 315-359.
Lindsay, R.A. (2010) Peatbogs and carbon: a critical synthesis to inform policy development in oceanic peat bog conservation and restoration in the context of climate change. Commissioned Report to the Royal Society for the Protection of Birds (RSPB).
Available from: http://www.uel.ac.uk/erg/PeatandCarbonReport.htm
Ratcliffe, D.A. and Walker, D. (1958) The Silver Flowe, Galloway, Scotland. Journal of Ecology, 46, 407–445.
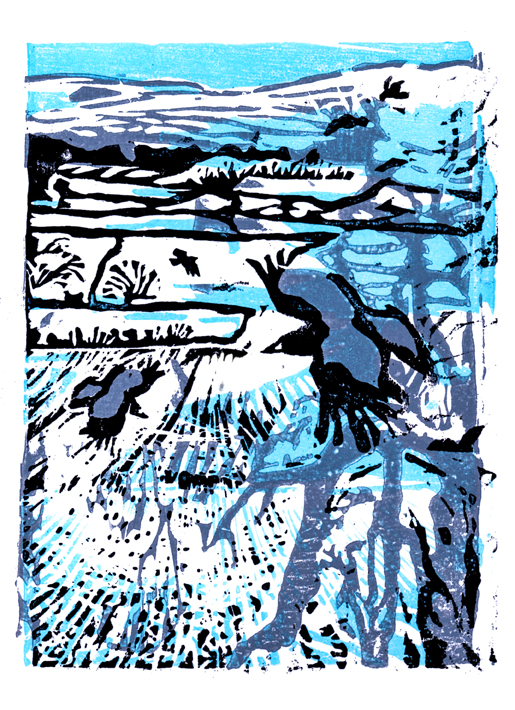
One of the most pleasing things about running a stall at the recent excellent IUCN UK Peatland Programme Annual Conference in Shrewsbury was the discovery that several fellow peatland people were also woodcut or linocut enthusiasts. I won’t name them because I don’t know whether they are ready to have their skills exposed to the public gaze but suffice it to say that some extremely enjoyable and instructive discussions took place during the coffee and lunch breaks. In discussing the various techniques which we have each explored, and given the wider interest shown in my ‘Snowy Rooks’ woodcut, it occurred to me that it might be interesting for people to see how this woodcut, with its associated printed card (both available through my Etsy store), was produced.
To begin with, two small holes were punched in the original drawing using the smallest setting on a leather hole punch. The drawing was then placed on a board of short-fibre MDF and the two holes in the drawing were marked onto the board. These marks were drilled using a small drill bit, then the holes in this board were used as guides to drill two holes in a second board of MDF. Small nails were then pushed through one board and the drawing was placed onto the board by slipping the holes in the drawing over the nails. After placing a sheet of carbon paper beneath the drawing, the areas of the design involving the palest blue were drawn round. The Board was then flipped over and the nails reversed. The drawing was again placed on the nails and the mid-blue colour areas were drawn round.
The nails were then transferred to the second board and the same process followed, but this time indicating the areas of grey, then the board was flipped over and finally the areas to be black were drawn around.
The four faces were then carved out to leave as raised surfaces only the areas relevant to that colour – although if an area is subsequently to be overprinted with a darker colour such areas do not need to be carved away because the dark ink will over-print onto the paler colour, obscuring it.
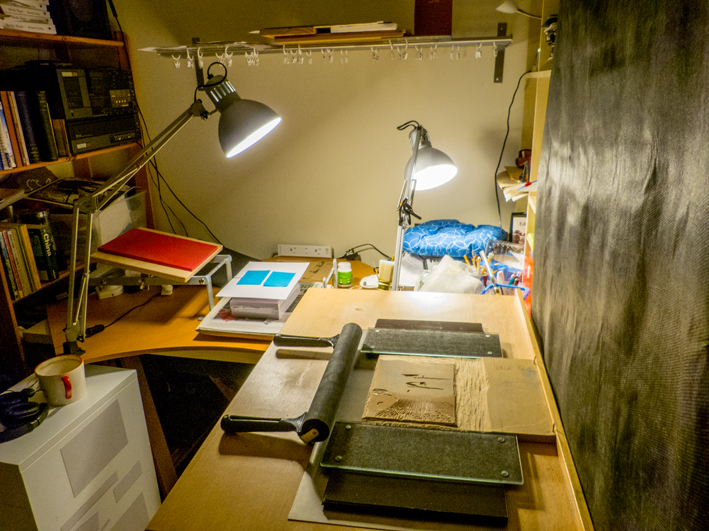
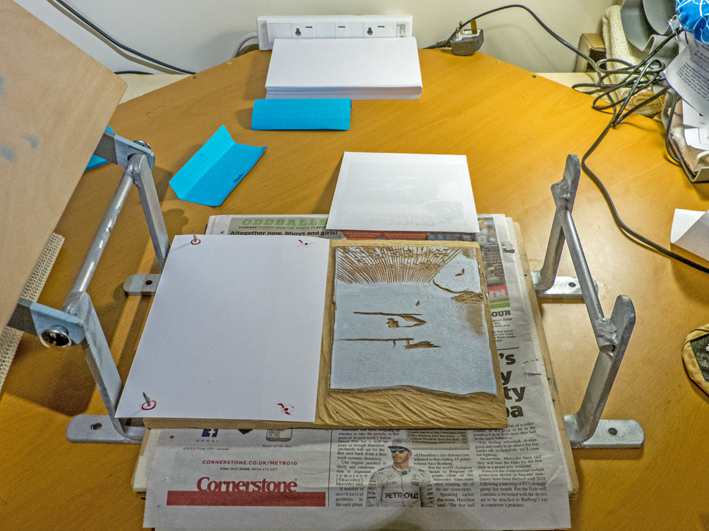
For both the proof-printing and final printing the woodblocks were positioned on a printing board and locked in place using glass plates positioned either side of the woodblock and raised to the level of the printing face using thin sheets of material – as seen here with the mid-blue block. This was to prevent the inking roller from rolling off the raised woodblock face and inking lower parts of the block.
After a certain amount of proof-printing to check that the carving was producing the correct effect, the four faces were cleaned and prepared for final printing. The palest block was positioned first as one generally prints in sequence from palest to darkest colours.
It was then inked using the palest ink.
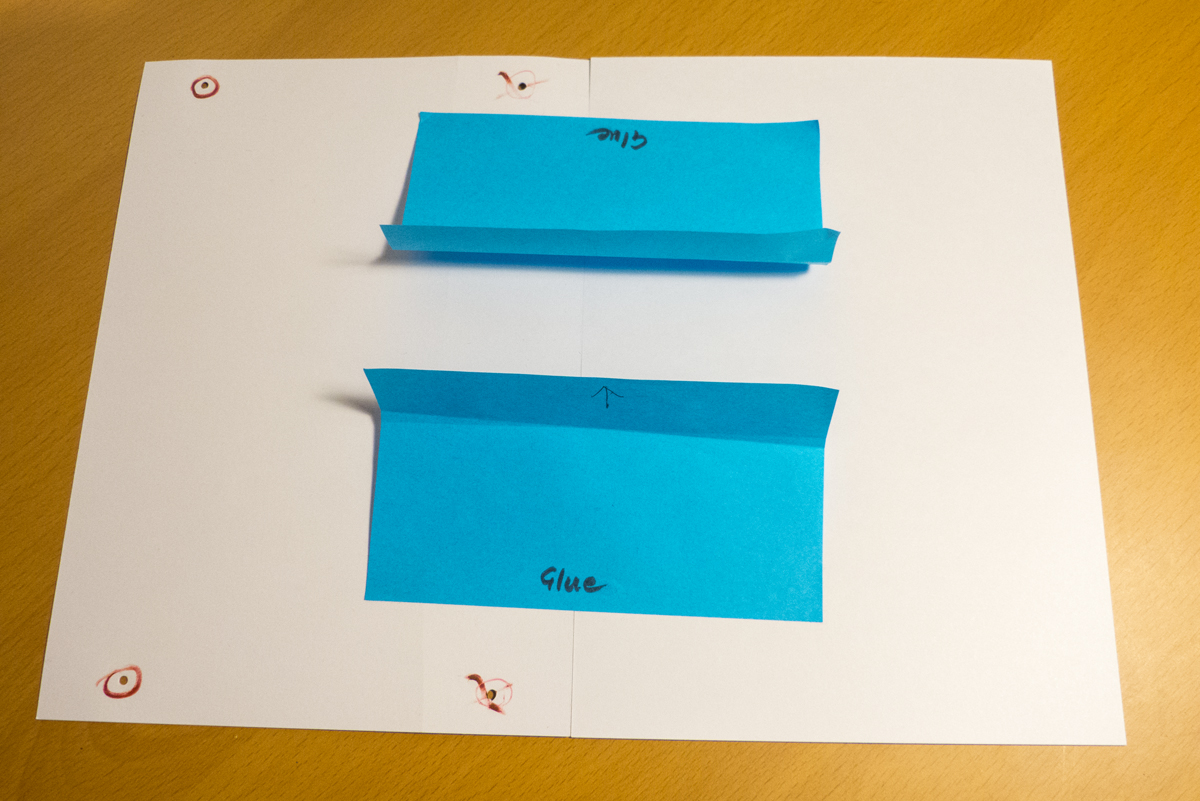
Having inked the block, a piece of A5 card with holes punched at the same positions as the nails in the woodblocks was then aligned with the card on which the design was to be printed. The two pieces of card were locked together, matching corners, using large post-it notes (!)
The hole-punched card and its companion card to be printed were then lifted and the hole-punched card dropped over the nails of the woodblock.
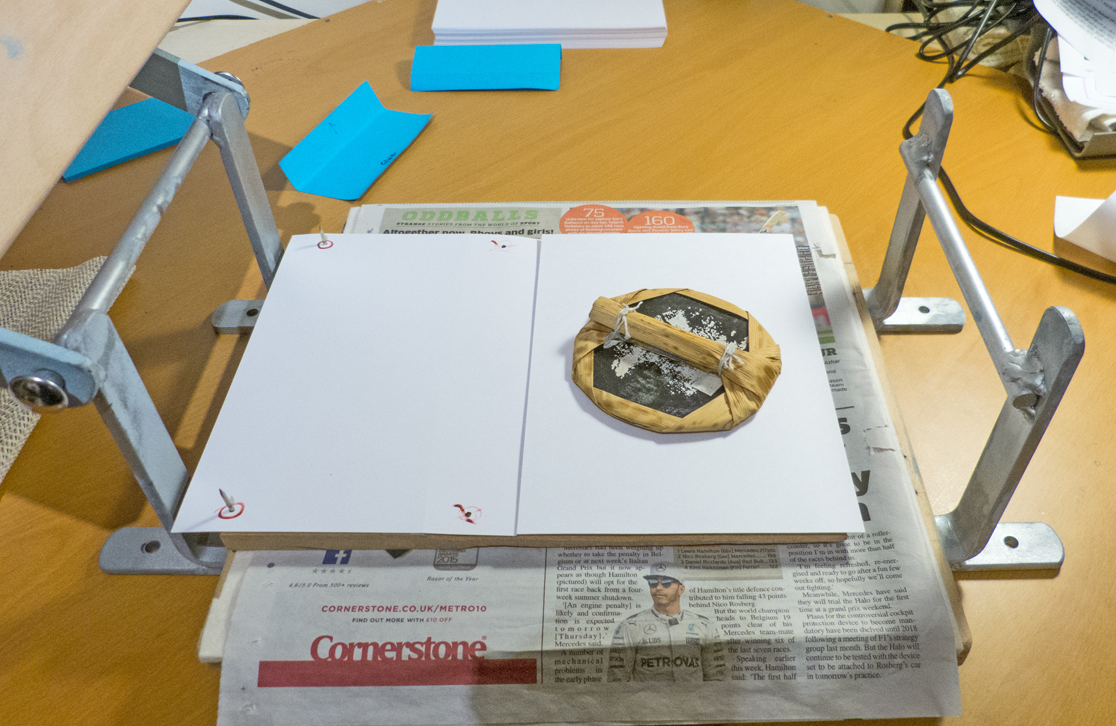
A sheet of greaseproof paper (removed here for clarity) was then placed onto the card to be printed in order to provide a slippery and protective surface to the back of the card and a ‘barren’ (traditional Japanese pad for burnishing woodblock paper onto the inked block) used to press the card against the ink, thus helping to fix it in place.
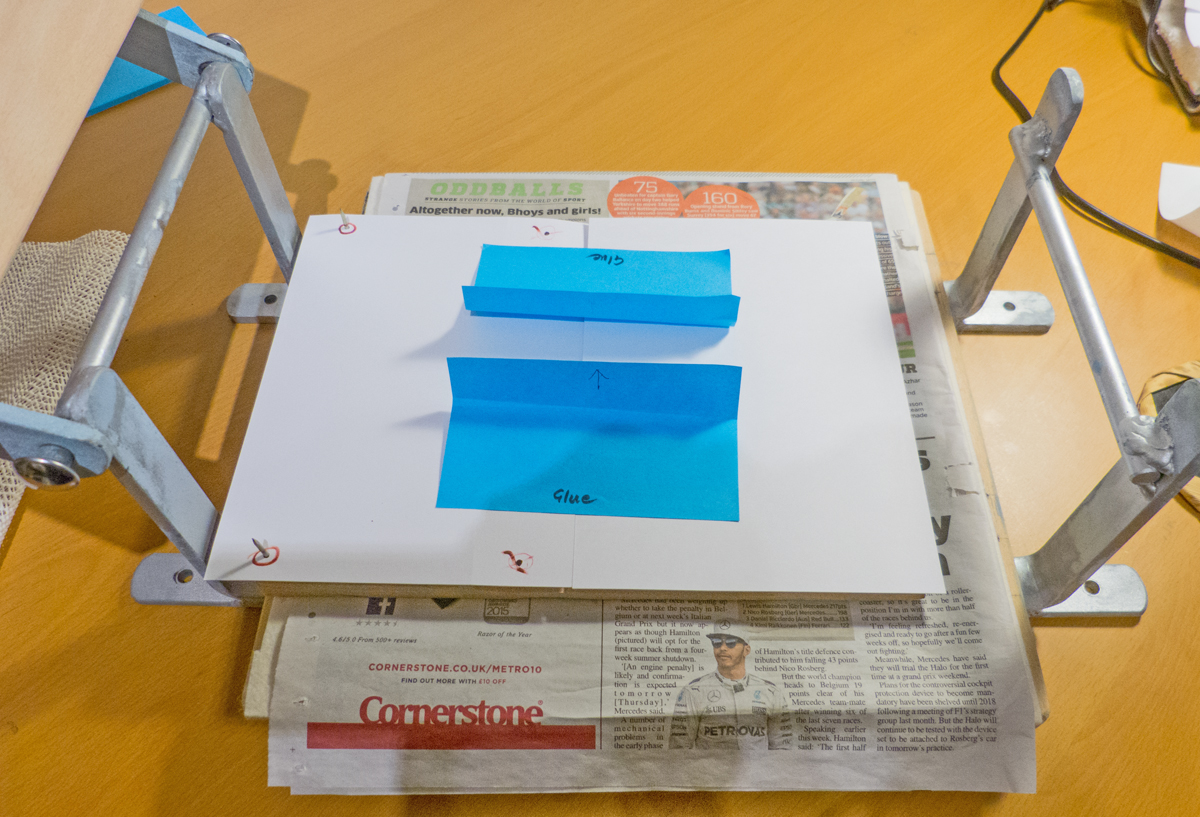
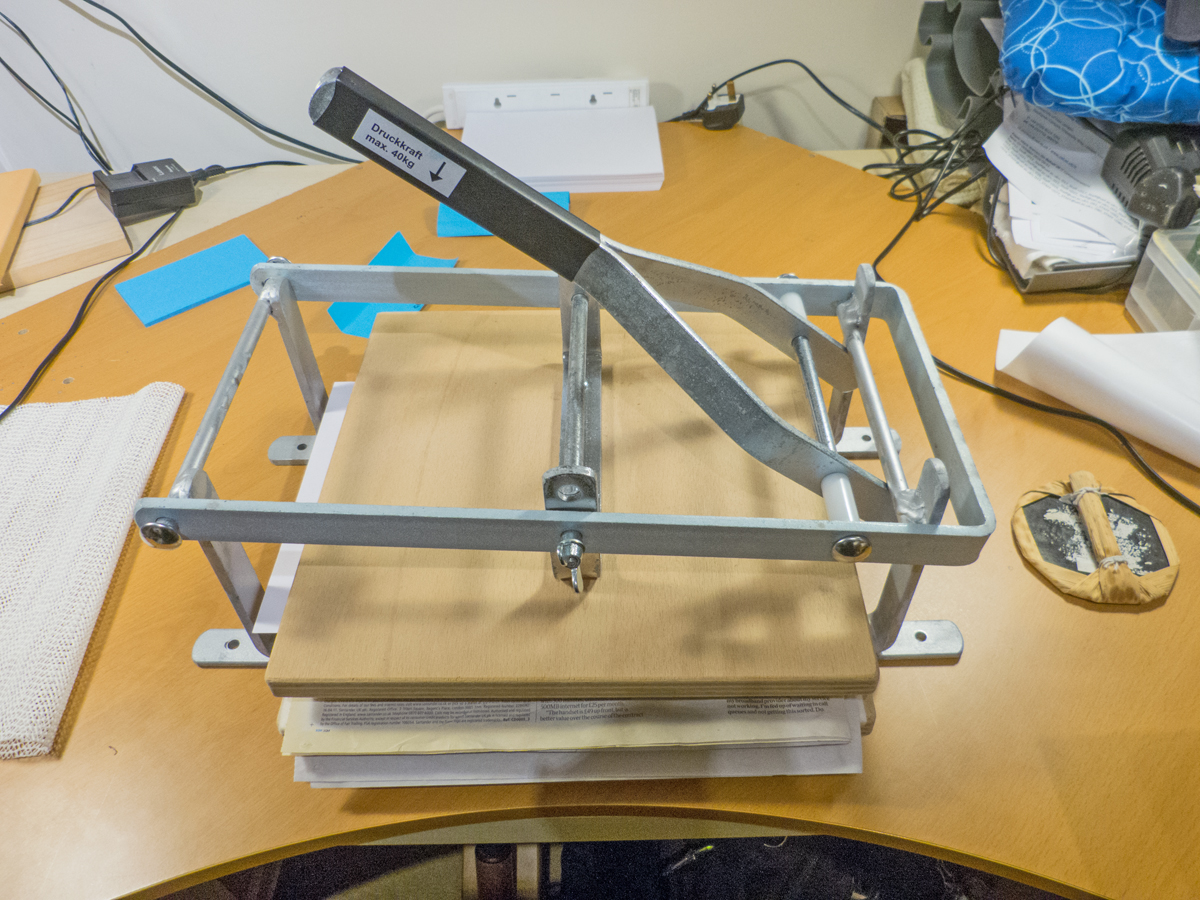
A pad was then placed on the print and the printing press closed over it to press the card to be printed firmly against the inked block.
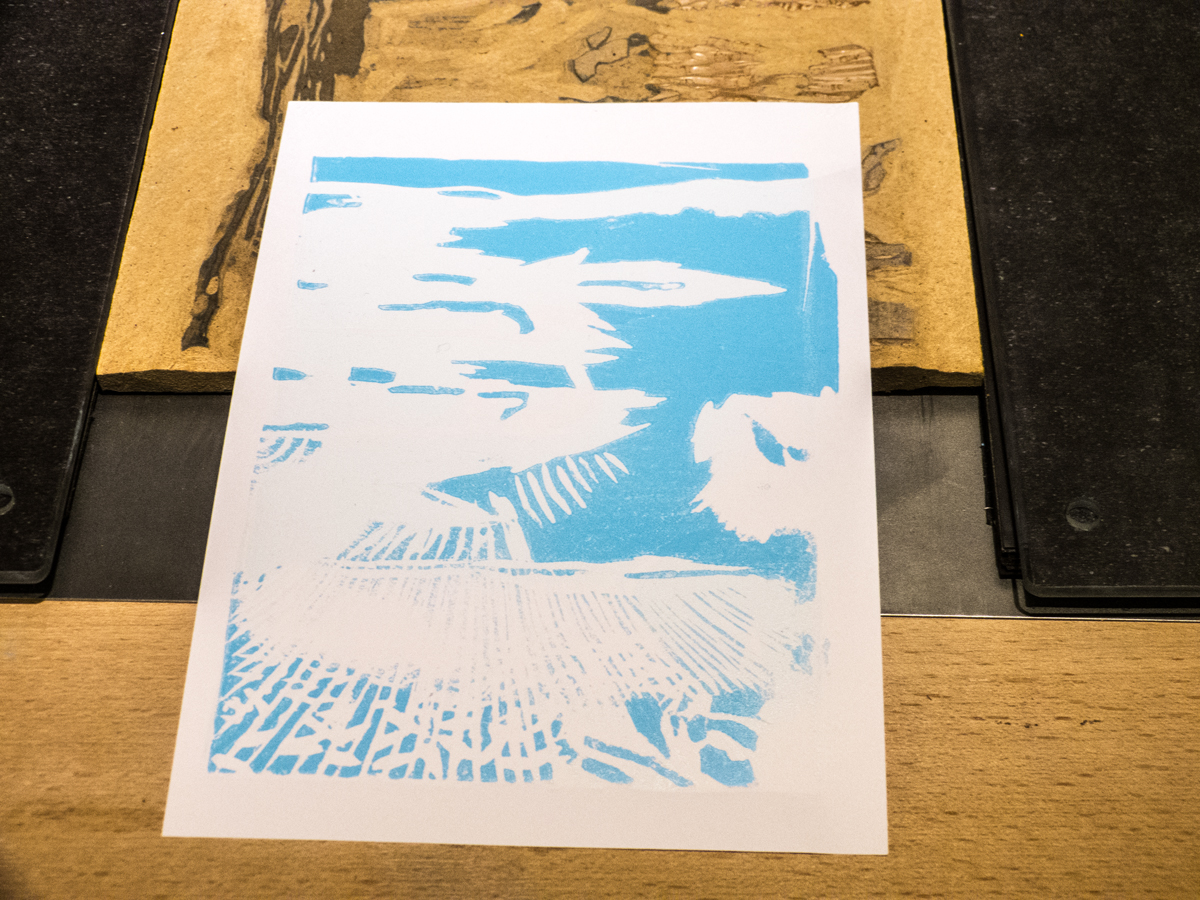
On opening up the press, the first print colour can be seen on the card.
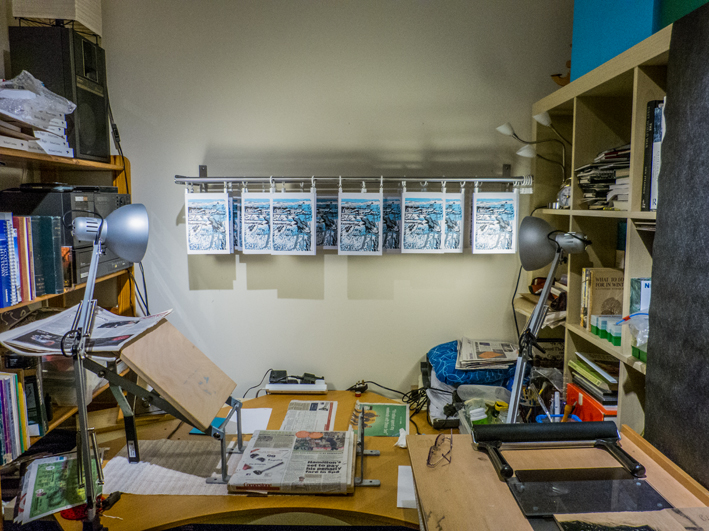
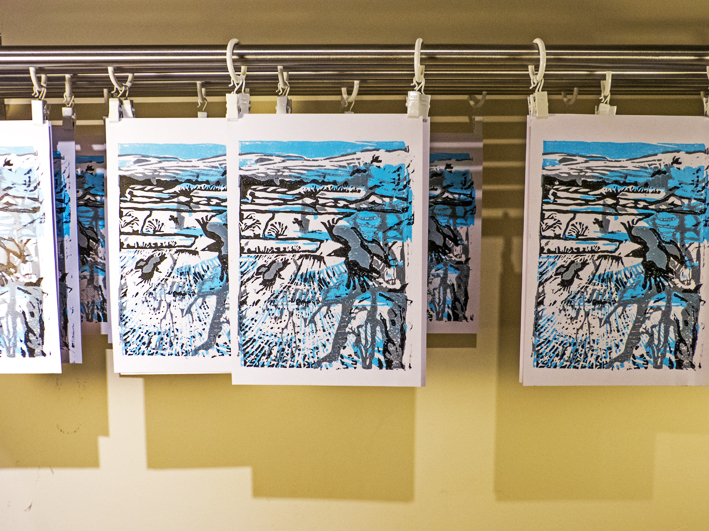
The whole print run is then completed for this palest colour and the cards hung up to dry.
The next block face is prepared and the cards printed using the next-darkest colour – namely the mid-blue – then the grey block is positioned for inking.
It all still looks pretty much without shape or form once the first three colours have been printed and can be rather depressing at this stage, wondering whether the whole design has failed. It is only with printing of the black that it becomes clear whether the whole exercise has been a total failure or not. That first print from the black block is nerve-racking. Fortunately the ‘Snowy Rooks’ emerged looking more-or-less as I’d hoped. It’s always possible to spot potential improvements, but overall the relief that it had largely succeeded was enormous and merited a glass of wine – after I’d printed all 30 sheets and hung them up to dry…
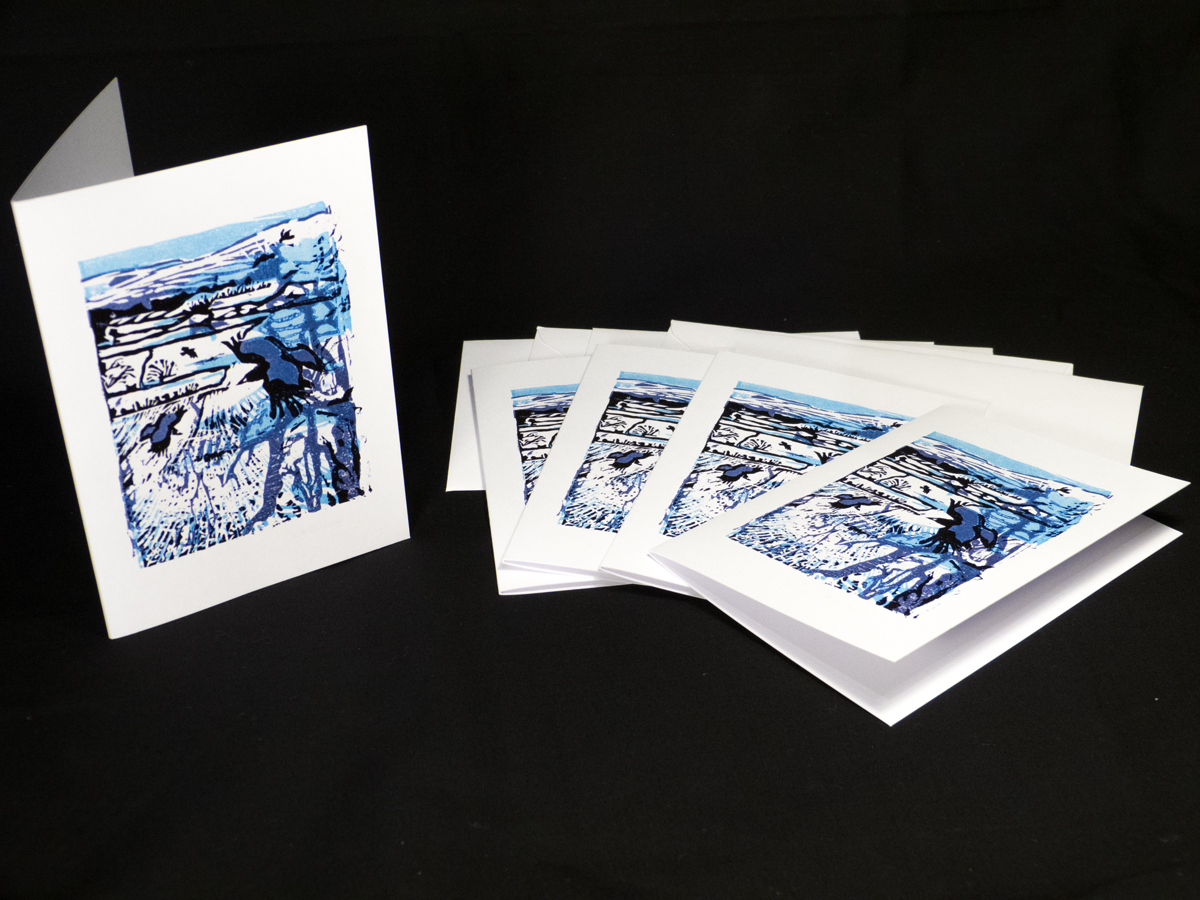
Interestingly when the cards were transferred digitally to Spingold Design and Print – my local friendly commercial printers – for conversion to greetings cards, the colours developed a subtle purple tinge which I rather like, so I think if I run off any more prints I’ll need to mix a little magenta with the cyan to create this overall tint. That said, I really need to be working on my design for the sundew linocut which is currently rattling around inside my head…
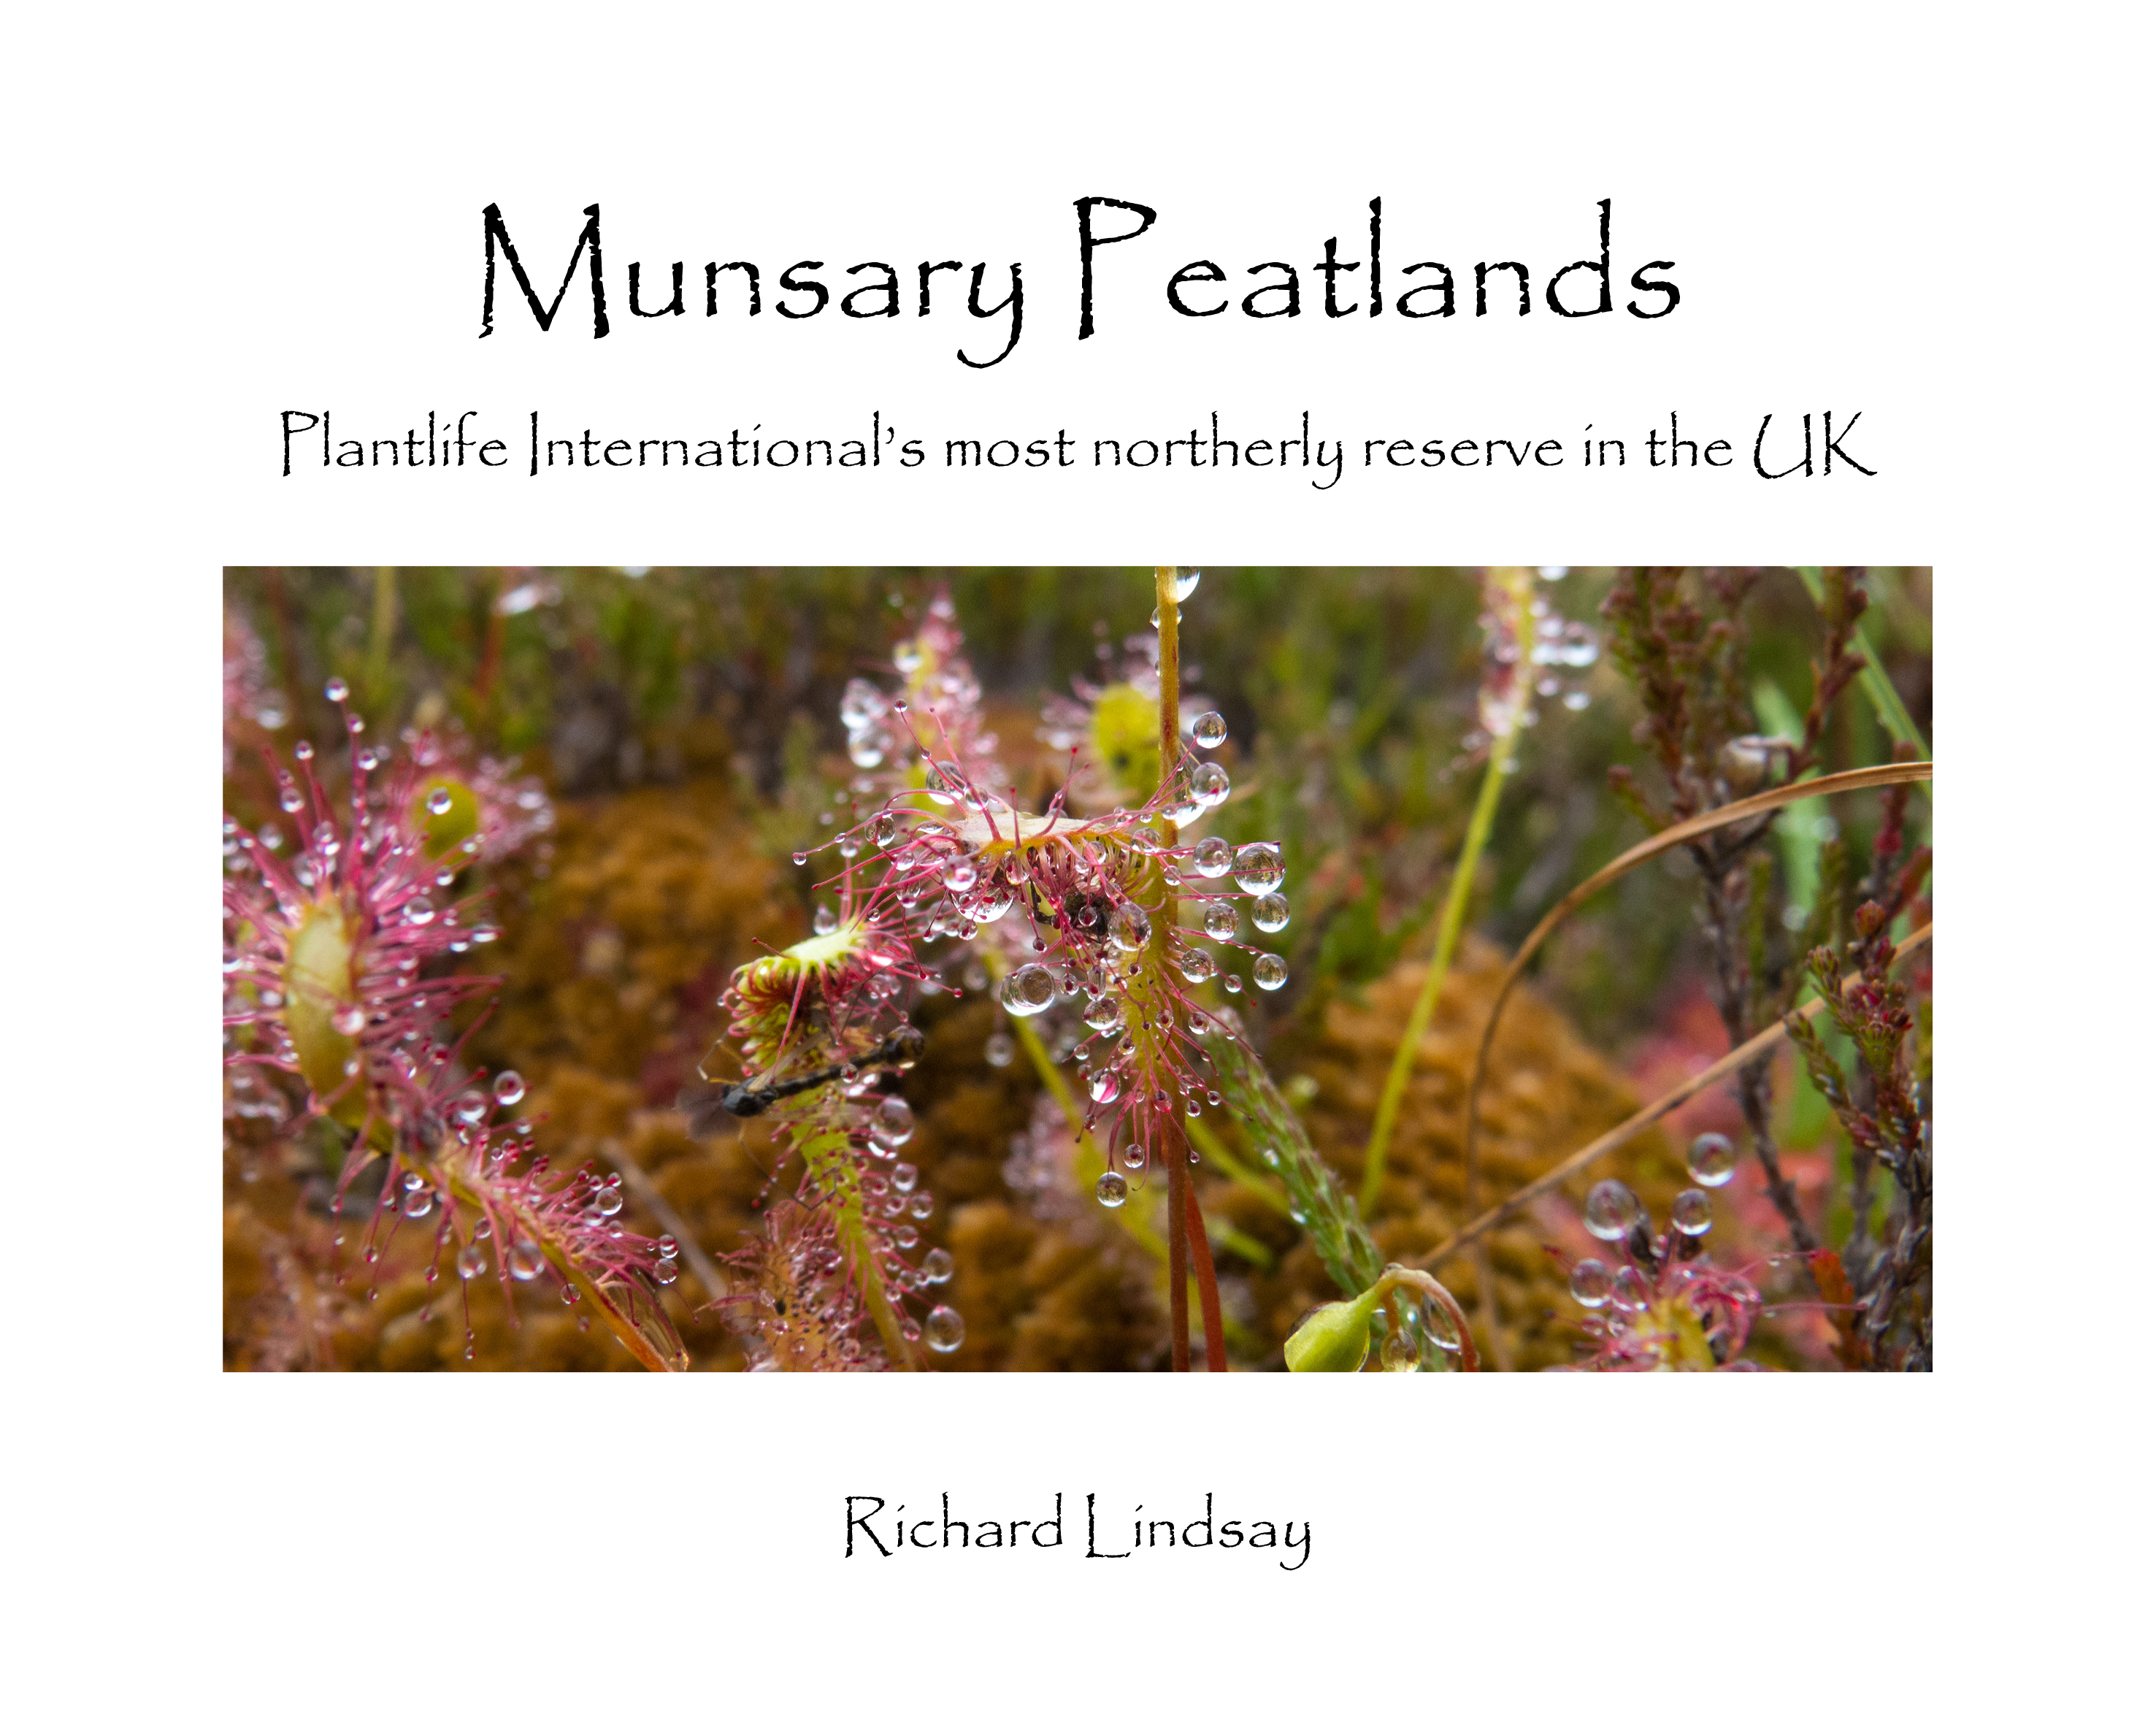
I now have a limited number of copies of my Munsary Peatlands photobook available at a discount from my Esty Store compared to the Blurb website (where you can preview the whole book).
Copies of the Munsary Peatlands photobook will be available through my Etsy Store from 14th December.
Meanwhile the revised link to the book on the Blurb UK webstore (apologies, there were a few typos which have been corrected) where it can be previewed in its entirety is:
If you have already ordered the previous version through Blurb and wish it to be replaced, please contact me on brittanymerlin007@gmail.com
The version on the Etsy Store will be the latest version.
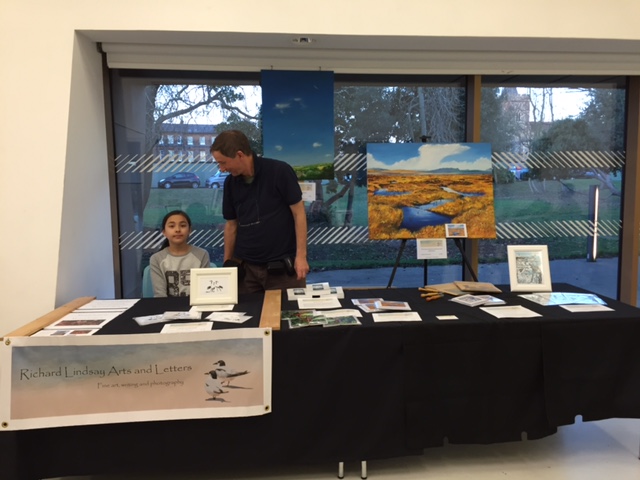
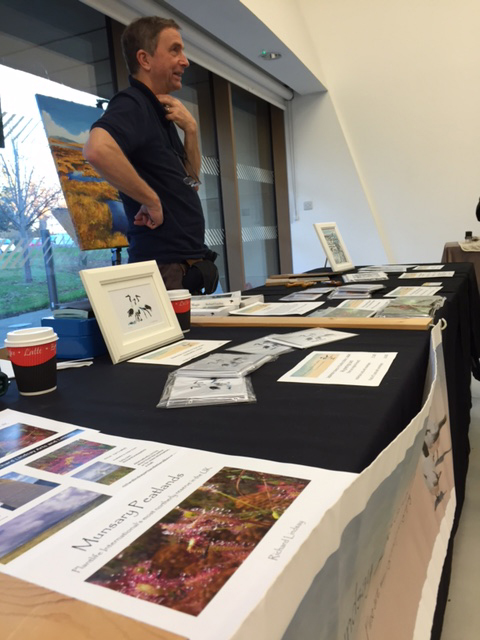
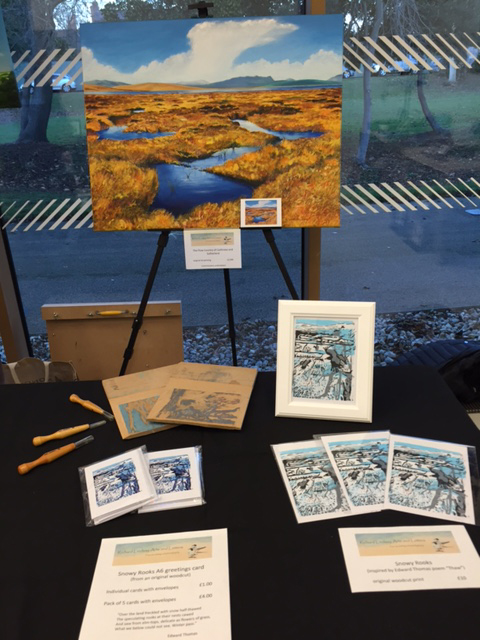
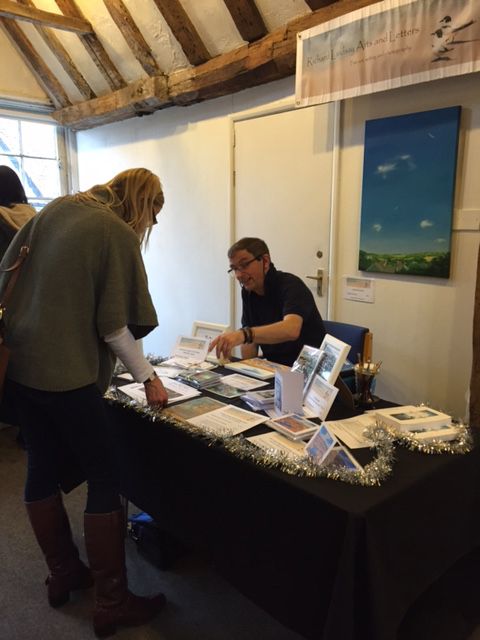
Another good day presenting and selling artworks and books (yes, even copies of the Merlin Magic book were selling). The ‘Snowy Rooks‘ are almost sold out. Today I was assisted by my little ‘business manager’, who successfully negotiated a few deals by herself and apparently really enjoyed running things while Dad was off looking for coffee… Very friendly fellow stall-holders, including the excellent Lauren Kelly, who very kindly guided me down the path of EasyCut lino and Caligo washable inks a couple of years ago.
All in all a thoroughly enjoyable day, and many thanks to the staff of FirstSite for organising the event so well.
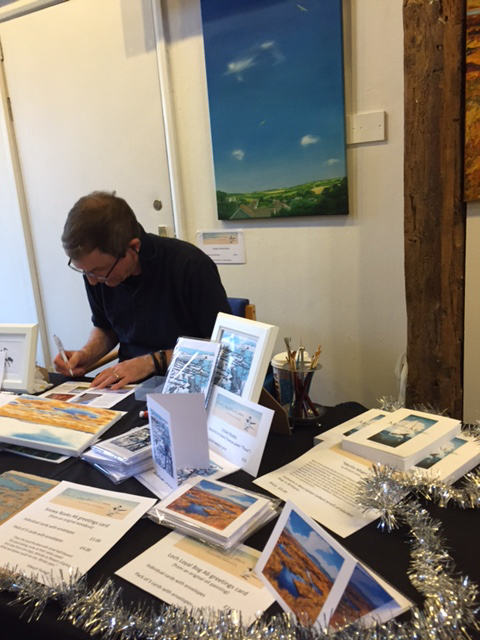
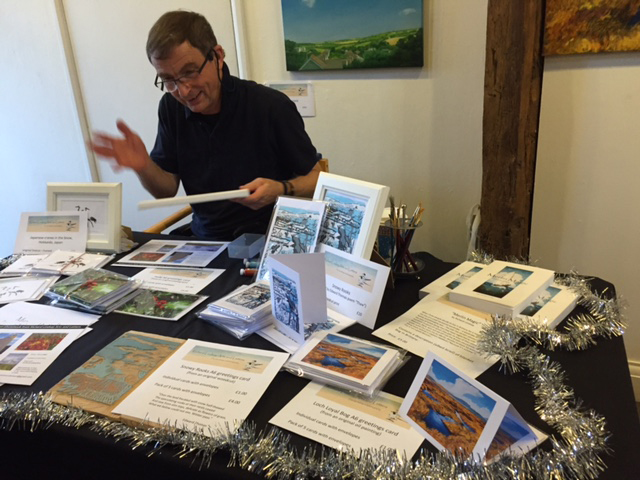
It’s been a busy week what with the excellent IUCN UK Peatland Programme 2016 Conference in Shrewsbury (of which more later) and now the weekend is taken up with the joint Minories/FirstSite Christmas Fair. Today’s fair was held in the Minories and a huge thank you to Becky Jordan and Nikki Hazelton for organising it and ensuring that everything went so smoothly. Big thank you to Hiroe as well for keeping me supplied with coffee (and the photos below), and to Dee for running the stall from time to time 🙂
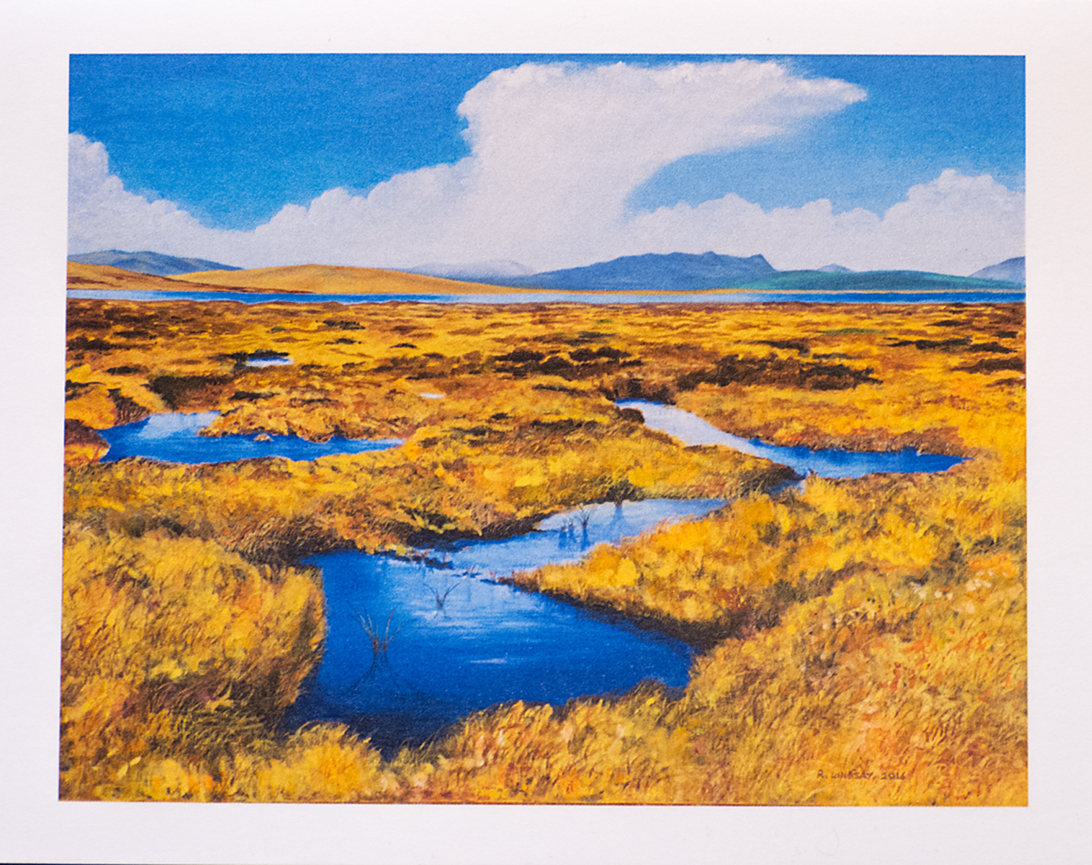
Having prepared myself for a day of long interludes with occasional flurries of activity, in the end I didn’t even manage to eat my breakfast bacon sandwich until 16:00 because things were so busy. The ‘Snowy Rooks‘ woodcut (original and cards) seemed to go down particularly well, although every item had some sales – apart from the large oil paintings which were more for display and promotional purposes. The ‘Loch Loyal Bog‘ painting (and associated cards) did indeed stimulate lots of discussion about peatlands, the Flow Country, Munsary Peatlands and general visits to Scotland. Several people have gone off to browse the Munsary Peatlands photobook online at Blurb.
Tomorrow the Fair is in the much larger venue of FirstSite – setting for the Open Exhibition back in the autumn of 2015. It would be great to see you there, if you are from the Colchester area.
Saturday 3rd December I’ll be in the Minories with my stall for their Christmas Fair, then on Sunday my stall moves to FirstSite.
In the still, dark hours of the night I’ve been busy completing a 4-colour-block woodcut inspired by the Edward Thomas poem “Thaw“, plus finally completing my large Flow Country oil painting.
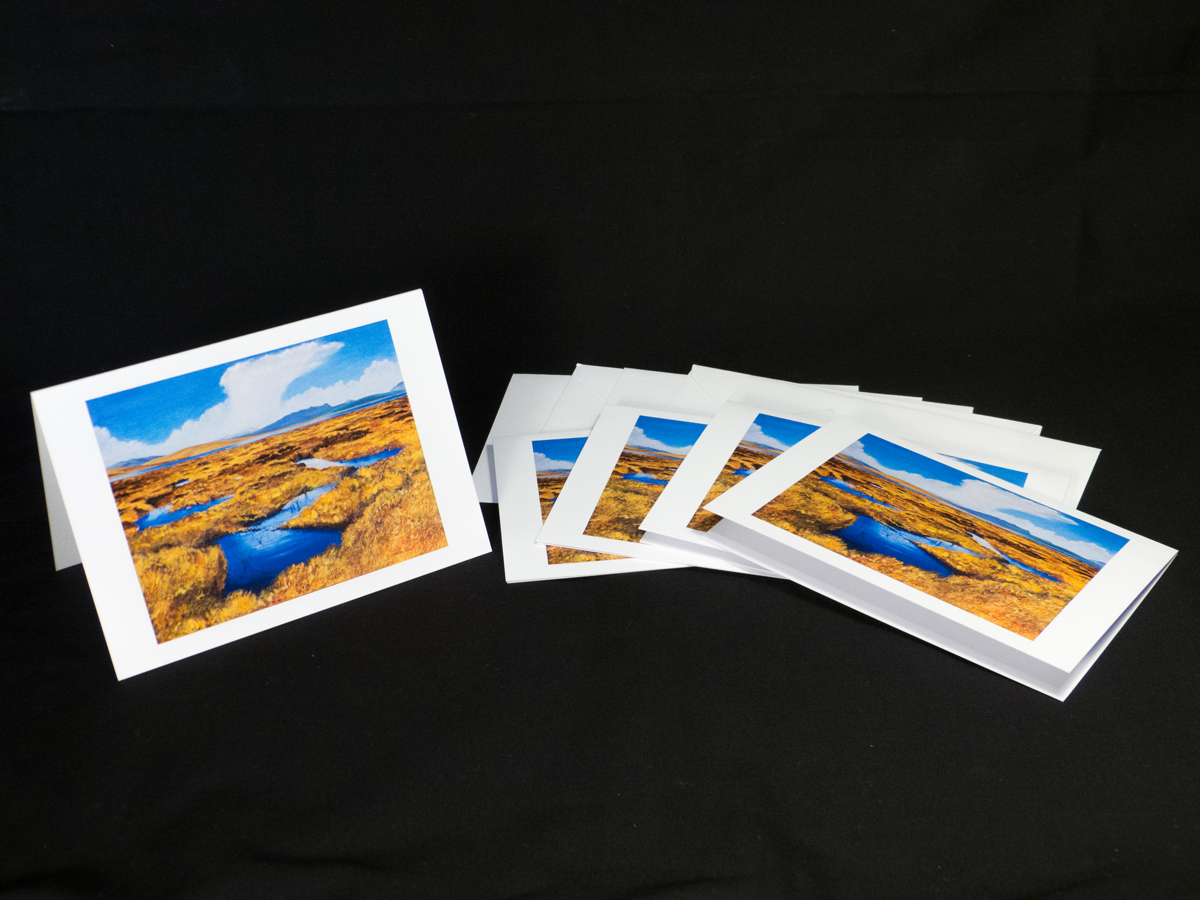
Both have been transposed onto small A6 greetings cards, which will be the main products available at the fair, along with a flyer for my Munsary Peatlands photobook, and of course copies of Merlin Magic.
More details about both these new artworks and their production in a subsequent blog. For the moment, if you are in the Colchester area this Saturday and Sunday, it would be great to see you.
Here’s the cards (which are also now available on my Etsy webstore):